Fig. 4
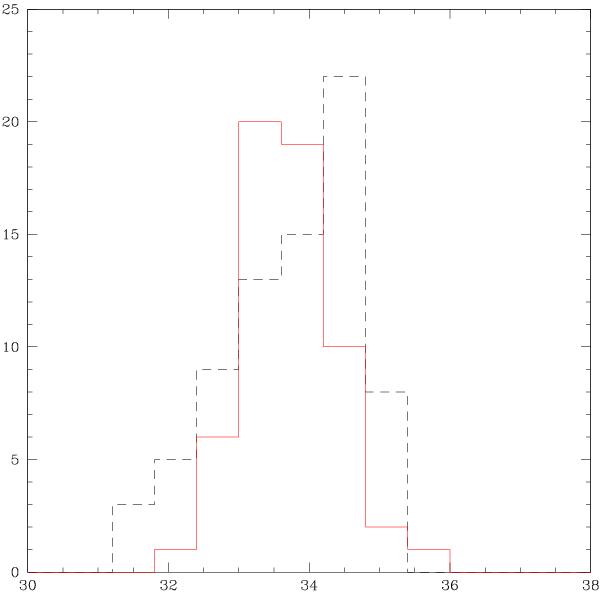
Distribution of the measured radial velocities (RV) for the sample stars, sub-divided into “giant” and “dwarf” sub-samples. Giants include all evolved stars with B − V > 0.7. No difference is present in the central value of the two distributions. The dwarf distribution (dashed black line) shows a larger spread than the giants (904 vs. 680 m s-1)
Current usage metrics show cumulative count of Article Views (full-text article views including HTML views, PDF and ePub downloads, according to the available data) and Abstracts Views on Vision4Press platform.
Data correspond to usage on the plateform after 2015. The current usage metrics is available 48-96 hours after online publication and is updated daily on week days.
Initial download of the metrics may take a while.