Fig. 8
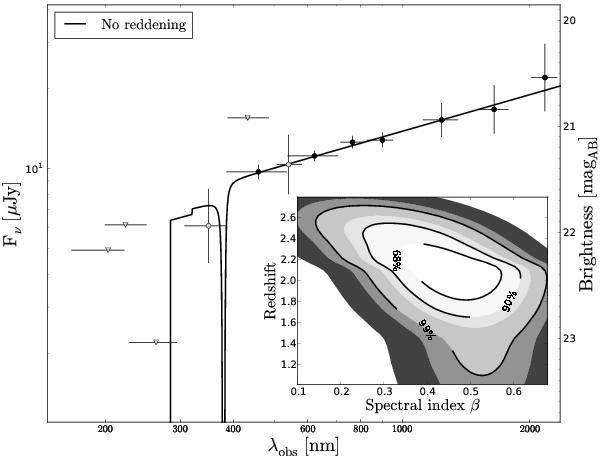
Foreground corrected broad-band spectral energy distribution of the afterglow of GRB 080906 with UVOT (open circles) and GROND (filled circles). Upper limits are shown by downward triangles. The SED shows a strong break due to the Lyman-limit being located in the uvw1 band. The photometric redshift is  . The inset shows the confidence contours of the redshift solution versus spectral index, where the three-dimensional
  parameter space has been collapsed onto a two-dimensional z − β grid. Lines and shadings are the same as in Fig. 7.
Current usage metrics show cumulative count of Article Views (full-text article views including HTML views, PDF and ePub downloads, according to the available data) and Abstracts Views on Vision4Press platform.
Data correspond to usage on the plateform after 2015. The current usage metrics is available 48-96 hours after online publication and is updated daily on week days.
Initial download of the metrics may take a while.