Fig. 6
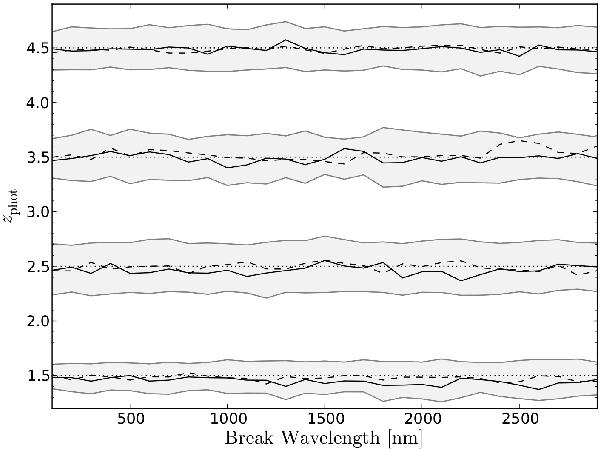
Photometric redshift accuracy for four synthetic bursts (z = 1.5, z = 2.5, z = 3.5 and z = 4.5) with a smoothly broken power law as continuum spectrum against the location of the break wavelength. Horizontal dashed lines mark the input redshift, and the best-fit photo-z for an unbroken continuum, and black solid lines the average best fit photometric redshift when following Sect. 2.4. Grey shaded areas represent the typical 1σ uncertainty, derived in similar manner as in Sect. 2.6.
Current usage metrics show cumulative count of Article Views (full-text article views including HTML views, PDF and ePub downloads, according to the available data) and Abstracts Views on Vision4Press platform.
Data correspond to usage on the plateform after 2015. The current usage metrics is available 48-96 hours after online publication and is updated daily on week days.
Initial download of the metrics may take a while.