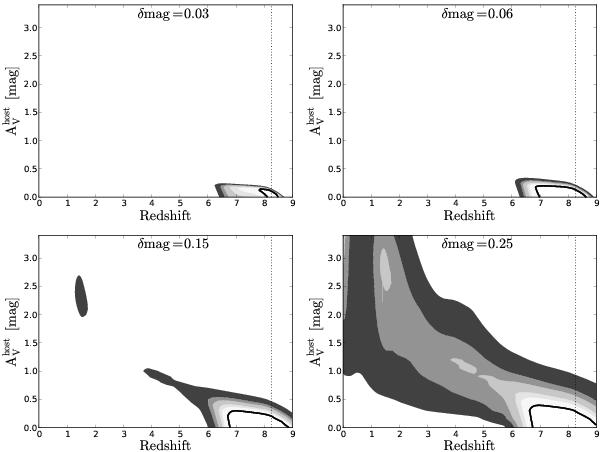
Fig. 5

Photometric redshift accuracy for GRB 090423 with different photometric errors. From top left to bottom right, the analysis was performed with the g′, r′, i′, z′, J, H, Ks data of Tanvir et al. (2009) but with photometric errors of ±0.03 mag, ±0.06 mag, ±0.15 mag and ±0.25 mag respectively. The black line corresponds to the 1σ contour, while the increasingly dark shaded areas correspond to the 90%, 95.4% (2σ), 99%, 99.73% (3σ) and 99.99% confidence contours. The vertical dashed line denotes the spectroscopic redshift.
Current usage metrics show cumulative count of Article Views (full-text article views including HTML views, PDF and ePub downloads, according to the available data) and Abstracts Views on Vision4Press platform.
Data correspond to usage on the plateform after 2015. The current usage metrics is available 48-96 hours after online publication and is updated daily on week days.
Initial download of the metrics may take a while.


