Fig. 2
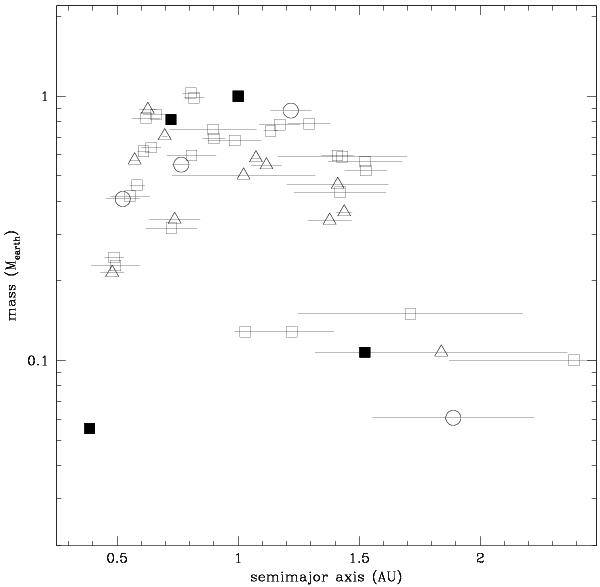
The final mass (M⊕) for each planet produced in our simulations is plotted as a function of the planet’s semimajor axis. The horizontal error bars show the locations of the perihelion and aphelion of the corresponding orbit. The open squares refer to the planets produced in the normal migration simulations, the open circles to the planets produced in the run with twice as many half-sized embryos, and the open triangles to those produced in the “perfect migration” simulations; the solid squares represent the real terrestrial planets.
Current usage metrics show cumulative count of Article Views (full-text article views including HTML views, PDF and ePub downloads, according to the available data) and Abstracts Views on Vision4Press platform.
Data correspond to usage on the plateform after 2015. The current usage metrics is available 48-96 hours after online publication and is updated daily on week days.
Initial download of the metrics may take a while.