Free Access
Fig. 7
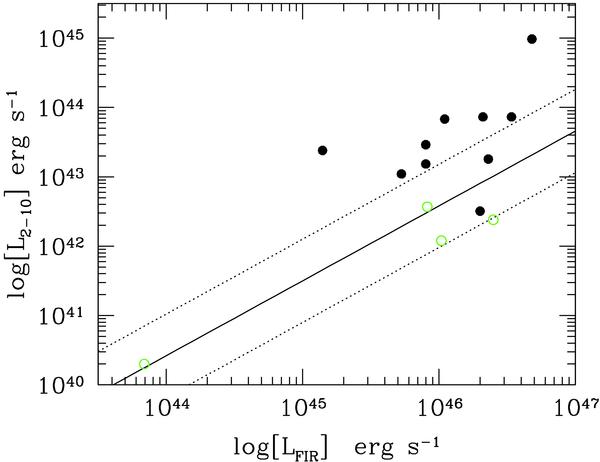
The X-ray (2–10 keV) vs. the FIR (4–100 μm) relation for our sources. The solid and dotted lines denote the best-fit relation of Ranalli et al. (2003), and its associated 2σ error, for normal galaxies in the local Universe. Open circles denote the four sources classified as galaxies on the basis of the X-ray diagnostics.
Current usage metrics show cumulative count of Article Views (full-text article views including HTML views, PDF and ePub downloads, according to the available data) and Abstracts Views on Vision4Press platform.
Data correspond to usage on the plateform after 2015. The current usage metrics is available 48-96 hours after online publication and is updated daily on week days.
Initial download of the metrics may take a while.