Fig. 4
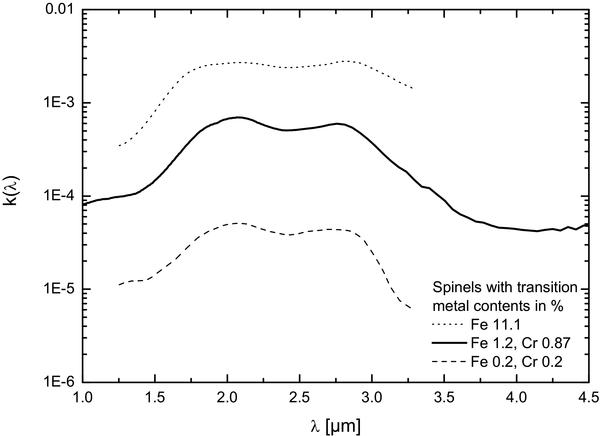
Comparison between the absorption indices derived for spinels with different transtion metal content. The solid line refers to our sample – with an Fe content of 1.2% and a Cr content of 0.87%. The dotted line refers to a very Fe-rich sample (Fe-content of 11.1%), the dashed line denotes an Fe-poor sample (both according to Lenaz et al. 2008). The Fe content of the samples clearly correlates with the respective k-values at 2 μm.
Current usage metrics show cumulative count of Article Views (full-text article views including HTML views, PDF and ePub downloads, according to the available data) and Abstracts Views on Vision4Press platform.
Data correspond to usage on the plateform after 2015. The current usage metrics is available 48-96 hours after online publication and is updated daily on week days.
Initial download of the metrics may take a while.