Fig. 6
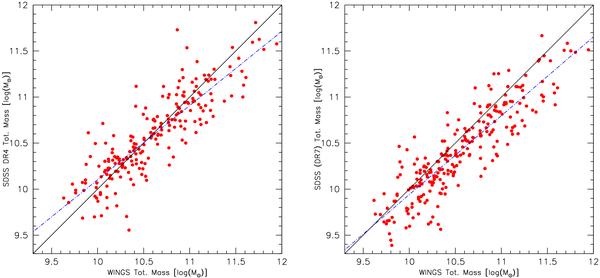
In the left panel we show the comparison between mass values from the sdss DR4, as calculated by Gallazzi et al. (2005), and those obtained by means of our spectrophotometric model on wings spectra and magnitudes. On the right panel we present the same comparison, but with DR7 masses, derived from total magnitude. The large scatter is due to the combination of both different methods and different data. The black line is the 1:1 relation, and the red line is the least-square fit to the data for both plots. All the values are rescaled to the Kroupa (2001) IMF, and a colour correction term has also been applied to wings masses (see Sect. 4.2).
Current usage metrics show cumulative count of Article Views (full-text article views including HTML views, PDF and ePub downloads, according to the available data) and Abstracts Views on Vision4Press platform.
Data correspond to usage on the plateform after 2015. The current usage metrics is available 48-96 hours after online publication and is updated daily on week days.
Initial download of the metrics may take a while.