Fig. 4
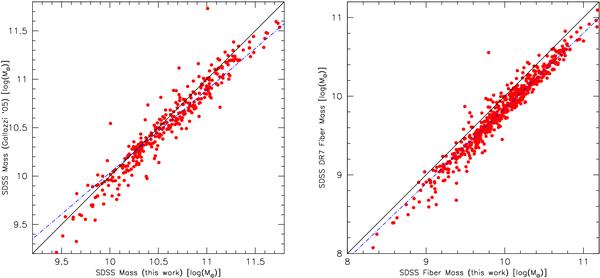
In the left panel we show the comparison between mass values that we obtained by fitting sdss spectra with our model, and those calculated by Gallazzi et al. (2005). The black line represents the 1:1 relation and the blue dotted-dashed line is the least-square fit to the data. On the right, we compare mass values we derived using our spectrophotometric fitting on the sloan’s fiber spectrum, to those obtained from DR7 photometric data fitting, referring to the same aperture. Lines and symbols as in the left panel. All sets of mass values have been corrected to account for differences in the assumed IMF (see text for details), and those that are shown here are normalized to the Kroupa (2001) IMF.
Current usage metrics show cumulative count of Article Views (full-text article views including HTML views, PDF and ePub downloads, according to the available data) and Abstracts Views on Vision4Press platform.
Data correspond to usage on the plateform after 2015. The current usage metrics is available 48-96 hours after online publication and is updated daily on week days.
Initial download of the metrics may take a while.