Fig. 3
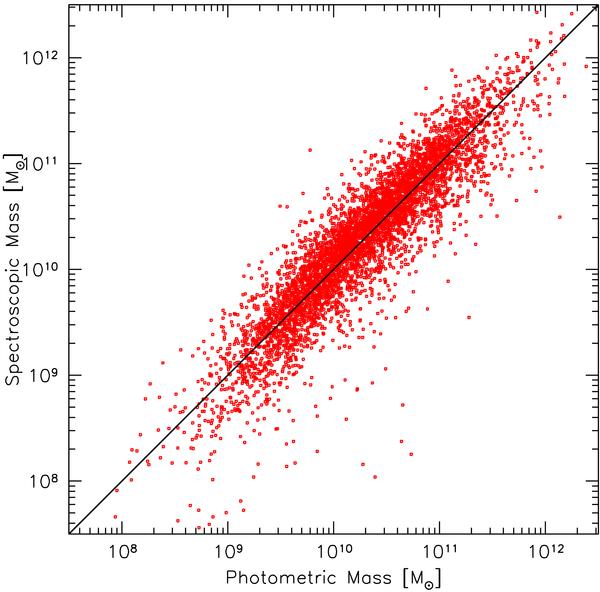
A comparison of the total stellar mass of galaxies in the wings sample, as computed by means of B and V band photometry, on the x-axis, assuming the prescriptions given in (Bell & de Jong 2001, see text for details), and by means of our spectral fitting. The solid line represents the 1:1 relation. A colour correction term, computed as explained in the text, was applied to the spectroscopic-derived values, while the photometric values were corrected to account for the difference in the IMF mass limits.
Current usage metrics show cumulative count of Article Views (full-text article views including HTML views, PDF and ePub downloads, according to the available data) and Abstracts Views on Vision4Press platform.
Data correspond to usage on the plateform after 2015. The current usage metrics is available 48-96 hours after online publication and is updated daily on week days.
Initial download of the metrics may take a while.