Fig. 1
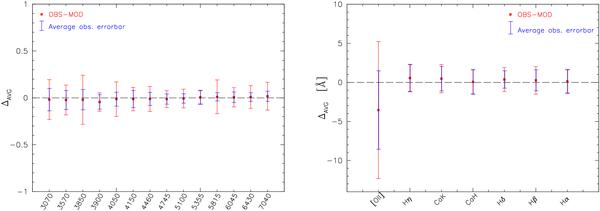
In this figures we plot the values of the difference, Δ, between spectral features in the observed and model spectra, averaged over all the spectra of the wings sample with an acceptable spectral fit (χ2 < 3). On the left panel we show the differences calculated for the continuum flux (both observed and model spectra have been normalized to 1 at 5500 Å), and on the right panel for the equivalent width of the lines. Red points represent the average value of Δ, for each one of the continuum bands and emission lines that were used as constraints in the fit. The red errorbars are the corresponding rms, while blue ones are the average of the observed rms.
Current usage metrics show cumulative count of Article Views (full-text article views including HTML views, PDF and ePub downloads, according to the available data) and Abstracts Views on Vision4Press platform.
Data correspond to usage on the plateform after 2015. The current usage metrics is available 48-96 hours after online publication and is updated daily on week days.
Initial download of the metrics may take a while.