| Issue |
A&A
Volume 526, February 2011
|
|
|---|---|---|
| Article Number | A44 | |
| Number of page(s) | 7 | |
| Section | Stellar structure and evolution | |
| DOI | https://doi.org/10.1051/0004-6361/201015203 | |
| Published online | 20 December 2010 | |
Doppler images of the RS CVn binary II Pegasi during the years 1994–2002⋆
1
Department of Physics, University of Helsinki,
PO Box 64,
00014
Helsinki,
Finland
e-mail: This email address is being protected from spambots. You need JavaScript enabled to view it.
2
Astrophysikalisches Institut Potsdam, An der Sternwarte 16, 14882
Potsdam,
Germany
3
Department of Physics and Astronomy, Uppsala
University, Box
516, 751 20
Uppsala,
Sweden
Received:
13
June
2010
Accepted:
24
October
2010
Abstract
Aims. We publish 16 Doppler imaging temperature maps for the years 1994–2002 of the active RS CVn star II Peg. The six maps from 1999-2002 are based on previously unpublished observations. Through Doppler imaging we want to study the spot evolution of the star and in particular compare this with previous results showing a cyclic spot behaviour and persistent, active longitudes.
Methods. The observations were collected with the SOFIN spectrograph at the Nordic Optical Telescope. The temperature maps were calculated using a Doppler imaging code based on Tikhonov regularization.
Results. During 1994-2001, our results show a consistent trend in the derived longitudes of the principal and secondary temperature minima over time such that the magnetic structure appears to rotate somewhat more rapidly than the orbital period of this close binary. A sudden phase jump in the active region occurred between the observing seasons of 2001 and 2002. No clear trend over time is detected in the derived latitudes of the spots, indicating that the systematic motion could be related to the drift of the spot-generating mechanism rather than to differential rotation. The derived temperature maps are quite similar to the ones obtained earlier with different methods and the main differences occur in the spot latitudes and relative strength of the spot structures.
Conclusions. We observe both longitude and latitude shifts in the spot activity of II Peg. However, our results are not consistent with the periodic behaviour presented in previous studies.
Key words: stars: individual: HD 224085 / stars: activity / stars: imaging / starspots
Full Table 1 is only available in electronic form at the CDS via anonymous ftp to cdsarc.u-strasbg.fr (130.79.128.5) or via http://cdsarc.u-strasbg.fr/viz-bin/qcat?J/A+A/526/A44
© ESO, 2010
1. Introduction
II Pegasi (HD 224085) is one of the very active RS CVn stars with a rotation period of 6.72433 days. RS CVn stars are closely detached binaries where the more massive component is a G-K giant or subgiant and the secondary usually a subgiant or dwarf of spectral class G to M (Huenemoerder et al. 2001). Because of the low luminosity of the secondary, many RS CVn systems appear as single-line binaries, thereby making their spectral analysis easier.
II Pegasi has been spectroscopically monitored for almost 19 years with the SOFIN spectrograph at the Nordic Optical Telescope (NOT, La Palma, Spain), and it is part of our long-term observational projects on stellar magnetic activity. Previous studies of the surface temperature distribution of II Peg include the papers of Berdyugina et al. (1998a), who present surface temperature maps for 1992−1996, and Bergyugina et al. (1999b) with surface maps for 1996−1999. Both studies were based on observations with the SOFIN spectrograph at NOT. Gu et al. (2003) present surface images of II Peg for 1999−2001 based on observations with the Coude échelle spectrograph at the Xinglong station of the National Astronomical Observatories, China, but the spectral lines used for inversions were different from those of the SOFIN observations.
Photometric light curve variations of the star were analysed by Berdyugina & Tuominen (1998) and by Rodonò et al. (2000). Berdyugina et al. (1998a,b, 1999a,b) and Berdyugina & Tuominen (1998) present results of two active longitudes separated approximately by 180°, migrating in the orbital reference frame, and a switch in activity level that occurs periodically with a period of about 4.65 years. In the surface images of Gu et al. (2003), the general spot pattern was quite similar, but the drift with respect of the orbital frame was less obvious, and the switch in the activity level appeared to occur earlier than predicted by Berdyugina et al. Rodonò et al. (2000) find a much more complicated spot pattern from their photometric study: they report the existence of a longitudinally uniformly distributed component, together with three active longitudes, with cyclic behaviour.
Using Doppler imaging rotationally modulated distortions in spectral line profiles can be inverted on surface temperature maps (Vogt et al. 1987). Even though Doppler imaging is a powerful method to study stellar surfaces in detail, the results should always be interpreted critically. The method suffers from difficulties in modelling spectral lines in late-type stars. Any errors in, say, the stellar and spectral parameters will result in systematic errors in the results (Hackman et al. 2001).
Spectropolarimetric observations in four Stokes parameters provide a new basis for Doppler imaging techniques (cf. Semel 1989; and Piskunov 2008). Time series of high-resolution spectropolarimetric observations have been successfully used for retrieving maps of the surface magnetic field for both late type stars, with temperature spots (Piskunov 2008; Carroll et al. 2009), and Ap stars with chemical abundance spots (Kochukhov et al. 2006). Carroll et al. (2009) applied a Zeeman-Doppler imaging technique to derive the magnetic field configuration on the surface of II Peg in 2004 and 2007 using spectropolarimetric (Stokes I and V) observations with SOFIN. Their maps show a very similar spot pattern to the one found by Berdyugina et al. (1998b, 1999b); moreover, the radial field direction was the opposite on different active longitudes. Using a new magnetic Doppler-imaging code and the SOFIN observations from 2004, Kochukhov et al. (2009) constructed a map of both the surface temperature and magnetic field of II Peg.
2. Spectroscopic observations with SOFIN
All the observations were made using the SOFIN high-resolution échelle spectrograph at the 2.6 m Nordic Optical Telescope (NOT), La Palma, Spain. The data were acquired with the second camera equipped with an EEV CCD detector of 1152 × 770 pixels and, from January 2002, with a new Loral one with 2048 × 2048 and higher quantum efficiency. For this study we used high-resolution spectra of II Peg measured in August 1994, July 1995, July 1996, October 1996, June 1997, August 1997, December 1997, July 1998, October 1998, November 1998, July−August 1999, September 1999, October 1999, August 2001, August 2002, and November 2002. The allover quality of the data was good during the years 1994−1995 (highest S/N 391, the lowest 251). During the years 1996−2002, the quality of the data was worse, with the S/N ratio around 300 at best, on average slightly over 200. The data also contained observations with very poor S/N (around 100 or even below). The phase coverage was in general satisfactory, except for the observing seasons of July 1996, September 1999, and October 1999.
The spectral region 6160−6210 Å was chosen for Doppler imaging, and the ephemeris used to calculate the phases  (1)was taken from Berdyugina et al. (1998b). The observations are summarized in Table 1, available at the CDS. In this table we give the heliosentric Julian dates, phases calculated according to the ephemeris given above, and the S/N for each observation.
The spectral observations were reduced with the 4A software system (Ilyin 2000). Bias, cosmic ray, flat-field and scattered light corrections, wavelength calibration and normalization, and corrections for the motion of the Earth were included in the reduction process.
Summary of inversion maps.
3. The Doppler-imaging technique
For Doppler imaging we use the invers7 code by Piskunov (Piskunov et al. 1990; Piskunov 1991). In this method the otherwise ill-posed inversion problem is solved by Tikhonov regularization. In practice this means introducing an additional structure constraint minimizing the surface gradient of the solution. The Doppler imaging solution is retrieved using a table of calculated local line profiles for different surface positions (limb angles) and different effective temperatures. The local line profiles are calculated using numerical models of stellar atmospheres. In the analysis presented here, we used the stellar model atmospheres of Kurucz (1993) with temperatures 3000−6000 K and gravity log g = 4.0. The stellar parameters used in the inversions, summarized in Table 2, were chosen mostly according to Berdyugina et al. (1998b)
The stellar parameters used in the inversions.
The following spectral lines were used in the surface temperature inversions: Fe I 6173.0050 Å, Ni I 6175.3600 Å, Ni I 6176.8070 Å, Ni I 6177.2560 Å, and Fe I 6180.2030 Å. All these lines are actually blends of lines. In all we included 30 lines within the wavelength range 6172−6182 Å in the analysis. Spectral line parameters were obtained from the Vienna Atomic Line Database (Kupka et al. 1999). Solar element abundance values and standard spectral parameters were used as a starting point. A preliminary analysis showed that the Ni abundance, in particular, had to be adjusted from the solar value of −5.79 to −5.50. The log (gf) values of two included Ni I lines were modified from the standard values of −0.53 to −0.540 (Ni I 6175.360 Å) and −0.390 (Ni I 6176.807 Å), because the standard values were found to produce a wrong balance between these lines.
4. Results
In total we calculated 16 temperature images of II Peg for the years 1994−2002. The images from the years 1999−2002 were based on previously unpublished SOFIN@NOT observations. The earlier observations, analysed with a different Doppler imaging method, were published by Berdyugina et al. (1998a, 1999b). The re-analysis of the already published data was considered to be important for detecting possible differences related to the inversion methods.
To study the evolution of the active regions, we estimated the location of the dominant spot features in each image. It is clear that it is usually hard to trace specific spots in images with long time intervals; however, the location of the dominant spot features will reflect the evolution of the underlying magnetic structures. Figures 1−17 show the results of the inversions; in Figs. 1−16, we show the derived temperature maps and in Fig. 17, the derived longitudes transformed into rotation phases (left panel) and latitudes (right panel) of the main cool-spot region versus time.
During August 1994 (Fig. 1), an extended spot structure is visible, located at mid-latitudes. The coolest region can be found roughly at phase 0.06, while a weaker and smaller structure is seen at the phase 0.77. Roughly 11 months later (July 1995, Fig. 2), the extended structure is still visible, although located at somewhat higher latitudes and apparently shifted by ~0.2 in phase. The temperature minima are not as pronounced as in 1994: the deeper minimum is now located roughly at 0.22, and the secondary one roughly at the position of the former primary minimum at 0.025.
 |
Fig. 1 Observing run in August 1994. Upper panel: Mercator projection of the obtained surface temperature distribution. Lower panel: observed (crosses) and calculated line profiles (solid lines). |
 |
Fig. 2 Observing run in July 1995. |
 |
Fig. 3 Observing run in July 1996. |
 |
Fig. 4 Observing run in October 1996. |
 |
Fig. 5 Observing run in June 1997. |
During the observing run of July 1996 (Fig. 3), the phase coverage is rather poor. The extended structure that persisted during the 1994 and 1995 observations is no longer visible, and the cool regions are now seen in the form of smaller spots at relatively low latitudes. The primary spot occurs approximately at phase 0.97 and latitude 35 degrees. The two other spots located at phases 0.78 and 0.5 are less significant, and so we left them out of Fig. 17. A few months later (October 1996, Fig. 4), cool regions can be seen at approximately the same locations. Their relative strength, however, changed dramatically: the former deepest minimum now appears as almost insignificant, while the formerly weakest structure at 0.5 is now clearly the strongest and largest one at 0.51. The strongest minimum appears at a somewhat higher latitude than in July. The time between the observing runs is short, because of to which the difference in the principal temperature minimum longitude cannot be explained by differential rotation due to changing latitude. A more likely explanation is related to short time-scale changes in the activity level of the spots.
During the observing seasons of 1997 (June, Fig. 5; August, Fig. 6; December, Fig. 7), the activity is concentrated around the phase 0.75 in all three maps. During June 1997, the spot structure is more elongated towards lower phases, with the principal minimum at a fairly low latitude of 21 degrees. In August 1997 the structure is still similarly elongated, but a general trend is that the whole structure is located somewhat higher in latitude (39 degrees). In December 1997, the lowest temperature is still around the same phase, but it has moved towards higher latitudes (44 degrees).
In July 1998 (Fig. 8) the primary spot structure, located at phase 0.75, half a year earlier, has clearly decreased in magnitude, while the weaker structure, now at phase 0.38, has grown stronger, so the structures have nearly the same strength as in July 1998. The principal minimum has a rather low latitude of 21 degrees, while the secondary minimum occurs higher, at latitude 48. A similar configuration is seen in the map for October 1998 (Fig. 9), although the structures have moved closer to each other in longitude (phases 0.38 and 0.62) and swapped their strength relative to each other. In November 1998 (Fig. 10), however, the spot structure at phase 0.62 is again stronger in our maps. We also note that the phase coverage for the observing seasons is poor for October and November 1998 making these maps less reliable.
Signs of peculiar apparently bright features, possibly related to outbursts such as stellar flares, can be seen as “absorption dips” in the spectra at phase 0.78 in October (Fig. 9) and phase 0.55 in November 1998 (Fig. 10.) The possibly transient nature of these dips would cause discrepancies in the solution, so these maps may be regarded as less reliable than for July 1998. Flares on II Peg in the optical spectral lines have been reported several times (Berdyugina et al. 1999a) and the surface patterns might change, including positions of the active regions, during optical flare events.
During the year 1999 (July−August 1999 Fig. 11, September 1999 Fig. 12, and October Fig. 13), an extended spot structure is seen in all maps, roughly in between phases 0.2 and 0.6. The minimum temperature occurs around phase 0.55 in all three maps, and its latitude is relatively low. A secondary wing-like structure is also visible, located at higher latitudes (72 degrees) and at the phase 0.24 during July 1999. In September, this structure has moved towards lower latitudes (53 degrees) and higher phase (0.27), and in October, even further in the same directions (latitude of 43 degrees and phase 0.39). We note that the phase coverage of the September and October observing runs is quite poor, so these maps are not as reliable as the July−August 1999 map.
 |
Fig. 6 Observing run in August 1997. |
 |
Fig. 7 Observing run in December 1997. |
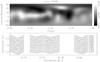 |
Fig. 8 Observing run in July 1998. |
 |
Fig. 9 Observing run in October 1998. |
 |
Fig. 10 Observing run in November 1998. |
 |
Fig. 11 Observing run in July–August 1999. |
 |
Fig. 12 Observing run in September 1999. |
 |
Fig. 13 Observing run in October 1999. |
 |
Fig. 14 Observing run in August 2001. |
 |
Fig. 15 Observing run in August 2002. |
 |
Fig. 16 Observing run in November 2002. |
Roughly 22 months later, in August 2001, (Fig. 14) the primary spot is still quite close to the phase it had during the 1999 observing seasons (moved from phase of 0.55 to 0.42). The latitude of the primary spot is somewhat higher in 2001 at 53 degrees. During the observing seasons with shorter gaps between the subsequent observations, rapid changes in the spot configuration were seen. Therefore it seems unlikely that the spot configuration has remained completely stable during the 22-month gap. One year later, in August 2002, the deepest temperature minimum has moved to phase 0.75, where it seems to persist also in the map from the November 2002 observations.
In the upper panel of Fig. 17, we plot the phases of temperature minima seen in the maps. The primary minima during 1997−2001, bar the October 1998 map, form a clear trend consistent with a stable spot structure moving in the orbital frame with a slightly shorter period (more rapidly). Some of the earlier primary minima fall on the same line. The trend quite clearly breaks down for the maps derived from the observations for 2002; in these maps, only one single minimum can be seen, located roughly at 0.75, well off the dotted line. The positions of the secondary minima do not form such a clear trend. In all derived maps, the secondary minima are close to the primary minima and hardly in any case their separation exceeds 0.2 in phase.
In the lower panel of Fig. 17 we plot the latitudes of the spot structures as a function of time. No systematic trends are visible in this plot, indicating that the systematic change in the spot positions during 1994−2001 cannot be attributed to differential rotation of spots at different latitudes. The spots seen in the maps of 2002, however, clearly show lower latitudes than during 2001. The accuracy of spot latitudes is in general less than spot longitudes in Doppler images. However in this case, we compare images calculated from observations of nearly same quality and phase coverage. The spot latitudes should therefore be comparable. For a solar-type differential rotation pattern (equator rotates more rapidly than the pole), such a change in latitude would speed up the rotation of the spot structure. Then the spot structure seems to be slowing down with respect to the systematic trend. Therefore, at least for solar-type differential rotation laws, the change in latitude is not a very likely cause of the change in the longitudinal position.
 |
Fig. 17 The longitude (upper panel) and latitude (lower panel) of the primary (triangles) and secondary (crosses) minima determined from the surface temperature maps as function of time. |
5. Discussion
Let us first compare our temperature maps (invers7-code with Tikhonov regularization) for 1994−1998 with the earlier ones obtained with a different inversion method (regularization with the Occamian approach). For the observing periods of August 1994 and July 1995, our maps agree reasonably with the ones of Berdyugina et al. (1998a). This is to be expected since identical sets of observations, with high S/N and good phase coverage, were used.
For July and October 1996, both the S/N and phase coverage is less satisfactory. Therefore the differences in the regularization methods can be expected to be more pronounced. Moreover, the observational data were not identical: Berdyugina et al. (1998a) had additional data from the the Crimean Astrophysical Observatory 2.6 m telescope Coudé spectrograph, so that their phase coverage was better for July 1996. The results indeed differ somewhat. Berdyugina et al. (1998a) recover two spots, the principal one being located within phases 0.8−1.0 consistently for both sets. Our maps show much more variability, with the primary spot clearly pronounced only in the October 1996 map at the phase 0.5.
For the 1997 observing seasons, the main temperature minima we have recovered match well the ones obtained by Berdyugina et al. (1999b) from identical observations (except for the phase 0.92 missing from our analysis during June 1997). However, the clear secondary minimum around the phase 0.25 in their maps is almost entirely absent in our maps. The spots are also consistently at higher latitudes in the maps by Berdyugina et al. than in ours.
Our maps for 1998 again show much more variability, especially in the relative strength of the primary and secondary temperature minima, than in the maps of Berdyugina et al. (1999b). They report only one significant change, a flip-flop of the relative strengths, which occurred between the observing seasons of Dec. 1997 and Jul. 1998. We also recover a similar change in relative strengths between these two data sets, but the activity level is observed to switch back only after a few months.
To summarize the re-analysis, we can conclude that, with good quality observational data, the main features can be recovered with both the inversion methods. When the noise level or phase coverage is poorer, or the spot features to be traced are weaker, the differences in the methods will influence the solution.
If the flip-flop configuration presented in Berdyugina et al. (1999b) persisted since July 1998, the highest activity should have occurred near phase zero during the year 1999 (see the dashed line approximating the path of the stronger active longitude in their Fig. 6). We find no spots near that phase. Moreover, the deepest temperature minimum occurs near the secondary minimum branch of Berdyugina et al. (1999b). Therefore, no clear support for the flip-flop phenomenon with the spot cycle proposed by Berdyugina et al. (1999b) can be found from our maps. In contrast, the unbroken trend seen in the primary spot longitudes continues at least until 2001, as can be seen from the upper panel of Fig. 17; after that, there is a long gap of 22 months in the observational data. In 2002 the recovered spot longitudes deviate clearly from the trend.
Gu et al. (2003) have also published temperature maps for the years 1999−2001, using both a different Doppler imaging method and data set. During July and August 1999, they found an extended high-latitude structure between phases 0.35 and 0.75, the primary minimum located near the phase 0.4 and the secondary one roughly at phase 0.75. The location of the primary minimum matches the one derived from our maps; however the position of the secondary one differs by 180 degrees. Their maps for February 2000 and November 2001 reveal a systematic drift in the primary spot location towards higher phases. Although the maps do not exactly cover the same time epochs, their trend seems to be consistent with the one we see.
All in all, the derived spot positions from our maps are consistent with a systematic drift of the spot structures in the orbital frame during (1994−2001). The spot-generating structure seems to be rotating somewhat more rapidly than the binary system. Between the observing seasons of 2001 and 2002, a jump in spot locations towards longer phases has occurred. This is roughly consistent with the trend seen by Gu et al. (2003) from a different set of observations for 1999−2001. As no systematic change in the spot latitudes over time can be seen, we cannot attribute this jump to its being related to differential rotation.
Acknowledgments
The results presented in this manuscript are based on observations made with the Nordic Optical Telescope, operated on the island of La Palma jointly by Denmark, Finland, Iceland, Norway, and Sweden, at the Spanish Observatorio del Roque de los Muchachos of the Instituto de Astrofisica de Canarias. The authors are grateful for the fruitful discussions with Jaan Pelt, Oleg Kochukhov, Thorsten Carroll, and Markus Kopf. Financial support from the Academy of Finland grant No. 112020 (M.L. and M.J.K.) is acknowledged. We acknowledge the anonymous referee for fruitful comments that helped us to improve the contents of the manuscript.
References
- Berdyugina, S. V., & Tuominen, I. 1998, A&A, 336, L25 [NASA ADS] [Google Scholar]
- Berdyugina, S. V., Berdyugin, A. V., Ilyin, I., & Tuominen, I. 1998a, A&A, 340, 437 [NASA ADS] [Google Scholar]
- Berdyugina, S. V., Jankov, S., Ilyin, I., Tuominen, I., & Fekel, F. C. 1998b, A&A, 334, 863 [NASA ADS] [Google Scholar]
- Berdyugina, S. V., Ilyin, I., & Tuominen, I. 1999a, A&A, 349, 863 [NASA ADS] [Google Scholar]
- Berdyugina, S. V., Berdyugin, A. V., Ilyin, I., & Tuominen, I. 1999b, A&A, 350, 626 [NASA ADS] [Google Scholar]
- Carroll, T., Kopf, M., Strassmeier, K., Ilyin, I., & Tuominen, I. 2009, in Cosmic Magnetic Fields: From Planets, to Stars and Galaxies, ed. K. G. Strasssmeier, A. G. Kosovichev, & J. E. Beckman, Proc. IAU Symp., 259, 437 [Google Scholar]
- Gu, S.-H., Tan, H.-S., Wang, X.-B., & Shan, H.-G. 2003, A&A, 405, 763 [NASA ADS] [CrossRef] [EDP Sciences] [Google Scholar]
- Hackman, T., Jetsu, L., & Tuominen, I. 2001, A&A, 374, 171 [NASA ADS] [CrossRef] [EDP Sciences] [Google Scholar]
- Huenemoerder, D. P., Canizares, C. R., & Schultz, N. S. 2001, ApJ, 559, 1135 [NASA ADS] [CrossRef] [Google Scholar]
- Ilyin, I. V. 2000, High resolution SOFIN CCD echelle spectroscopy, Ph.D. dissertation, University of Oulu [Google Scholar]
- Kochukhov, O., Tsymbal, V., Ryabchikova, T., Makaganyk, V., & Bagnulo, S. 2006, A&A, 460, 3 [Google Scholar]
- Kochukhov, O., Piskunov, N., Ilyin, I., & Tuominen, I. 2009, in Cosmic Magnetic Fields: From Planets, to Stars and Galaxies, ed. K. G. Strassmeier, A. G. Kosovichev, & J. E. Beckman, Proc IAU Symp., 259, 439 [Google Scholar]
- Kupka, F., & Ryabchikova, T. A. 1999, VALD-The Vienna Atomic Line Database: A Survey [Google Scholar]
- Kurucz, R. L. 1993, VizieR On-line Data catalog: VI/39 [Google Scholar]
- Piskunov, N. E. 1991, in The Sun and Cool Stars: activity, magnetism, dynamos, ed. I. Tuominen, D. Moss, & G. Ruediger, IAU Coll., 130, Lecture Notes in Phys., 380 (Springer-Verlag), 309 [Google Scholar]
- Piskunov, N. E. 2008, Phys. Scr., T133 [Google Scholar]
- Piskunov, N. E., Tuominen, I., & Vilhu, O. 1990, A&A, 230, 363 [NASA ADS] [Google Scholar]
- Rodonò, M., Messina, S., Lanza, A. F., Cutispoto, G., & Teriaca, L. 2000, A&A, 358, 624 [NASA ADS] [Google Scholar]
- Saar, S. H., & Baliunas, S. L. 1992, ASP Conf. Ser., 27 [Google Scholar]
- Semel, M. 1989, A&A, 225, 456 [NASA ADS] [Google Scholar]
- Vogt, S. S, & Penrod, G. D. 1983, of the International Astronomical Union, Proc. Colloq., 71, 379 [NASA ADS] [Google Scholar]
- Vogt, S. S., Penrod, G., & Hatzes, A. P. 1987, ApJ, 321, 496 [NASA ADS] [CrossRef] [Google Scholar]
All Tables
All Figures
|
Fig. 1 Observing run in August 1994. Upper panel: Mercator projection of the obtained surface temperature distribution. Lower panel: observed (crosses) and calculated line profiles (solid lines). |
| In the text | |
|
Fig. 2 Observing run in July 1995. |
| In the text | |
|
Fig. 3 Observing run in July 1996. |
| In the text | |
|
Fig. 4 Observing run in October 1996. |
| In the text | |
|
Fig. 5 Observing run in June 1997. |
| In the text | |
|
Fig. 6 Observing run in August 1997. |
| In the text | |
|
Fig. 7 Observing run in December 1997. |
| In the text | |
|
Fig. 8 Observing run in July 1998. |
| In the text | |
|
Fig. 9 Observing run in October 1998. |
| In the text | |
|
Fig. 10 Observing run in November 1998. |
| In the text | |
|
Fig. 11 Observing run in July–August 1999. |
| In the text | |
|
Fig. 12 Observing run in September 1999. |
| In the text | |
|
Fig. 13 Observing run in October 1999. |
| In the text | |
|
Fig. 14 Observing run in August 2001. |
| In the text | |
|
Fig. 15 Observing run in August 2002. |
| In the text | |
|
Fig. 16 Observing run in November 2002. |
| In the text | |
|
Fig. 17 The longitude (upper panel) and latitude (lower panel) of the primary (triangles) and secondary (crosses) minima determined from the surface temperature maps as function of time. |
| In the text | |
Current usage metrics show cumulative count of Article Views (full-text article views including HTML views, PDF and ePub downloads, according to the available data) and Abstracts Views on Vision4Press platform.
Data correspond to usage on the plateform after 2015. The current usage metrics is available 48-96 hours after online publication and is updated daily on week days.
Initial download of the metrics may take a while.