Fig. 8
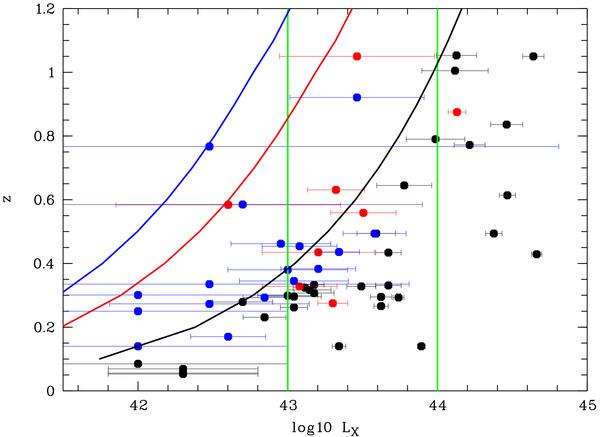
Present paper cluster distribution in a log 10(LX) versus redshift diagram. The two vertical green lines separate the most luminous, luminous, and moderately luminous clusters. Black disks are C1 clusters, red disks are C2 clusters, blue disks are C3 clusters. We also show as black, red, and blue curves the detection limit of the lowest X-ray flux cluster in C1, C2, and C3 classes.
Current usage metrics show cumulative count of Article Views (full-text article views including HTML views, PDF and ePub downloads, according to the available data) and Abstracts Views on Vision4Press platform.
Data correspond to usage on the plateform after 2015. The current usage metrics is available 48-96 hours after online publication and is updated daily on week days.
Initial download of the metrics may take a while.