Free Access
Fig. 19
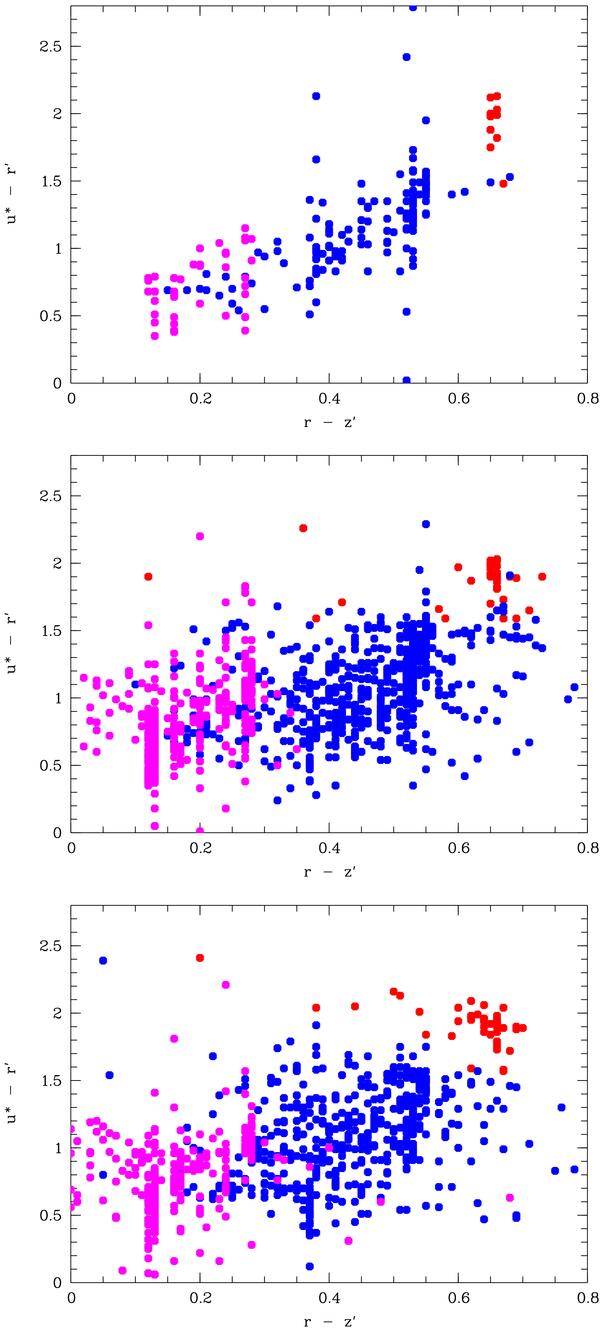
u∗ − r′ versus r′ − z diagrams with red dots being T ≤ 21 galaxies (early types), blue dots being 58 ≥ T ≥ 21 galaxies (late types), and pink dots being starburst galaxies. The upper figure is for the most luminous, the middle figure is for the luminous, and the lower figure is for the moderately luminous clusters.
Current usage metrics show cumulative count of Article Views (full-text article views including HTML views, PDF and ePub downloads, according to the available data) and Abstracts Views on Vision4Press platform.
Data correspond to usage on the plateform after 2015. The current usage metrics is available 48-96 hours after online publication and is updated daily on week days.
Initial download of the metrics may take a while.