Fig. 17
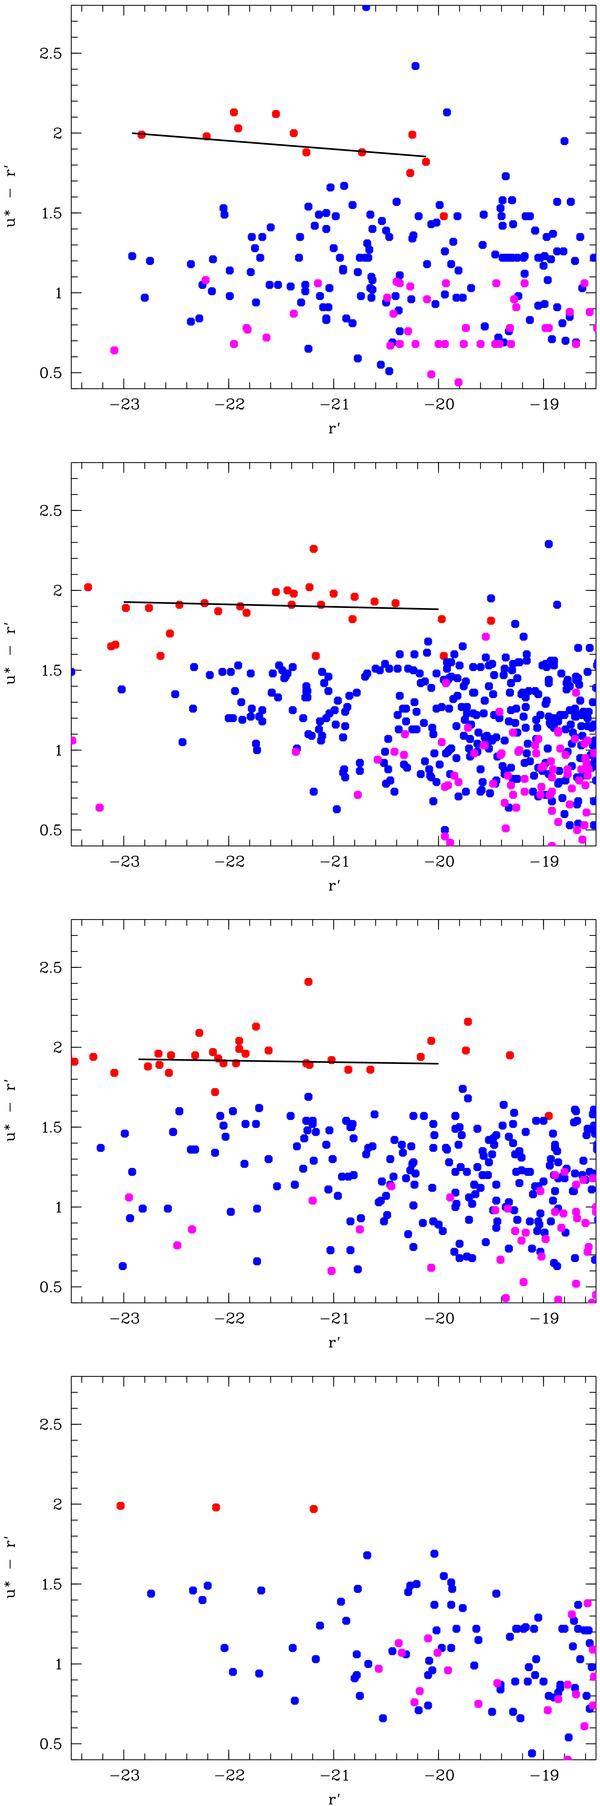
u∗ − r′ versus r′ with red dots being T ≤ 21 galaxies (early types), blue dots being 58 ≥ T ≥ 21 galaxies (late types), and pink dots being starburst galaxies. From top to bottom, figures are for the most massive, the massive, the moderately massive, and the z ≤ 1 C0 clusters. Absolute magnitude computations are based on photometric redshifts. Black continuous lines are the RSs computed with T ≤ 21 galaxies, except for C0 clusters where we had not enough available early-type galaxies.
Current usage metrics show cumulative count of Article Views (full-text article views including HTML views, PDF and ePub downloads, according to the available data) and Abstracts Views on Vision4Press platform.
Data correspond to usage on the plateform after 2015. The current usage metrics is available 48-96 hours after online publication and is updated daily on week days.
Initial download of the metrics may take a while.