Fig. 10
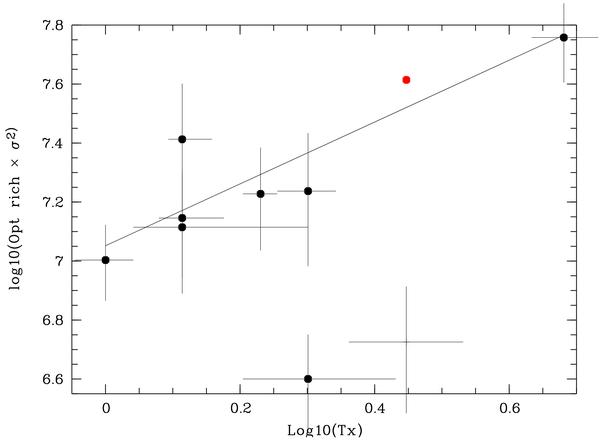
log(NRichσ2) versus log(TX) for the z ≥ 0.5 clusters (all C1 but XLSSC 046 which is C2). The + sign indicates XLSSC 027 and translates to the red disk when replacing the galaxy velocity dispersion by the weak lensing estimate from Gavazzi Soucail (2007). The continuous line is the fit (computed without XLSSC 027 and XLSSC 018): log(NRichσ2) = (1.05 ± 0.13) log(TX) + (7.05 ± 0.07).
Current usage metrics show cumulative count of Article Views (full-text article views including HTML views, PDF and ePub downloads, according to the available data) and Abstracts Views on Vision4Press platform.
Data correspond to usage on the plateform after 2015. The current usage metrics is available 48-96 hours after online publication and is updated daily on week days.
Initial download of the metrics may take a while.