Fig. 1
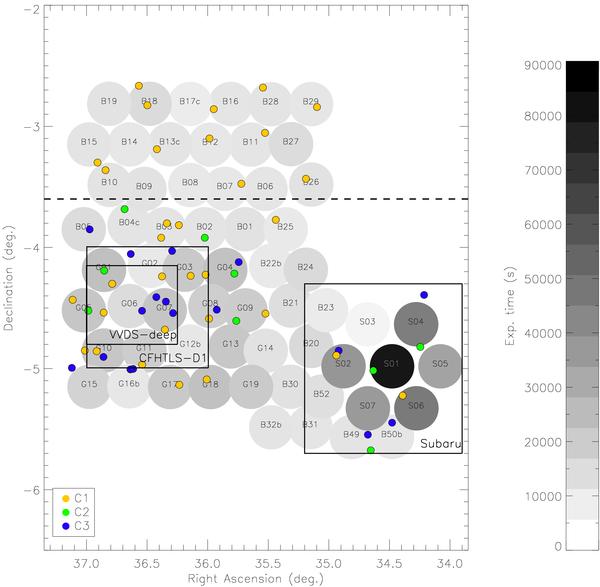
Map showing the different involved surveys. The gray level disks are the 11′ central areas of the XMM pointings (exposure time depends on the greyness). Large squares show the spectroscopic VVDS-deep and Subaru Deep surveys, and the CFHTLS D1 field. C1, C2, and C3 clusters are also shown. Above a declination of −3.6 deg, only g′,r′,z′ coverage is available, hence no photometric redshifts are derived for this zone.
Current usage metrics show cumulative count of Article Views (full-text article views including HTML views, PDF and ePub downloads, according to the available data) and Abstracts Views on Vision4Press platform.
Data correspond to usage on the plateform after 2015. The current usage metrics is available 48-96 hours after online publication and is updated daily on week days.
Initial download of the metrics may take a while.