Fig. 4
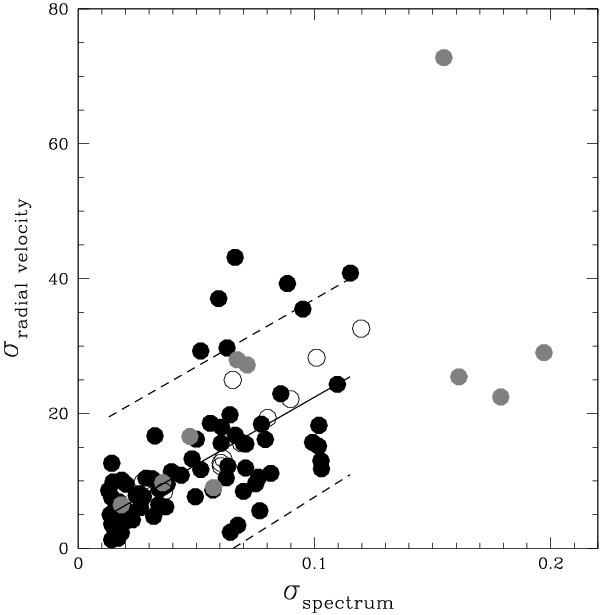
The scatter in the radial velocities from individual spectra versus the signal-to-noise ratio of the spectra. The solid black dots are from spectra with no annotation in Table 1 (i.e. good spectra), the grey dots are from noisy spectra, and the open symbols refer to spectra containing a G band.
Current usage metrics show cumulative count of Article Views (full-text article views including HTML views, PDF and ePub downloads, according to the available data) and Abstracts Views on Vision4Press platform.
Data correspond to usage on the plateform after 2015. The current usage metrics is available 48-96 hours after online publication and is updated daily on week days.
Initial download of the metrics may take a while.