Fig. 3
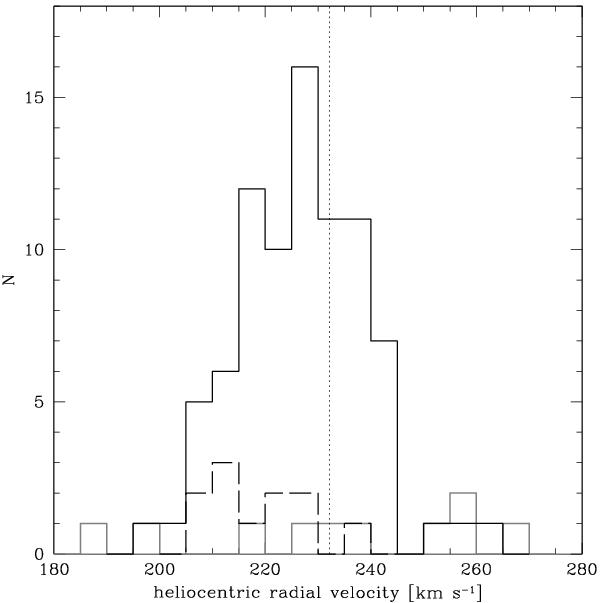
The distribution of heliocentric radial velocities. The solid black line shows the distribution for spectra with no notation in Table 1, the dashed black line shows the distribution for spectra showing a G-band and the solid grey line shows the distribution for noisy spectra. The heliocentric radial velocity of ω Cen is marked by the dotted line at 232.2 km s-1 (Harris 1996).
Current usage metrics show cumulative count of Article Views (full-text article views including HTML views, PDF and ePub downloads, according to the available data) and Abstracts Views on Vision4Press platform.
Data correspond to usage on the plateform after 2015. The current usage metrics is available 48-96 hours after online publication and is updated daily on week days.
Initial download of the metrics may take a while.