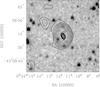
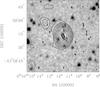
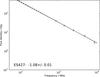
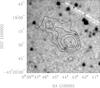
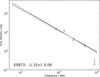
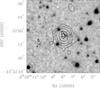
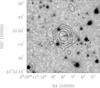
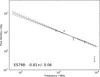
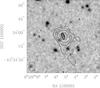
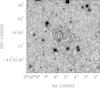
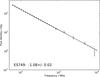
Fig. 5
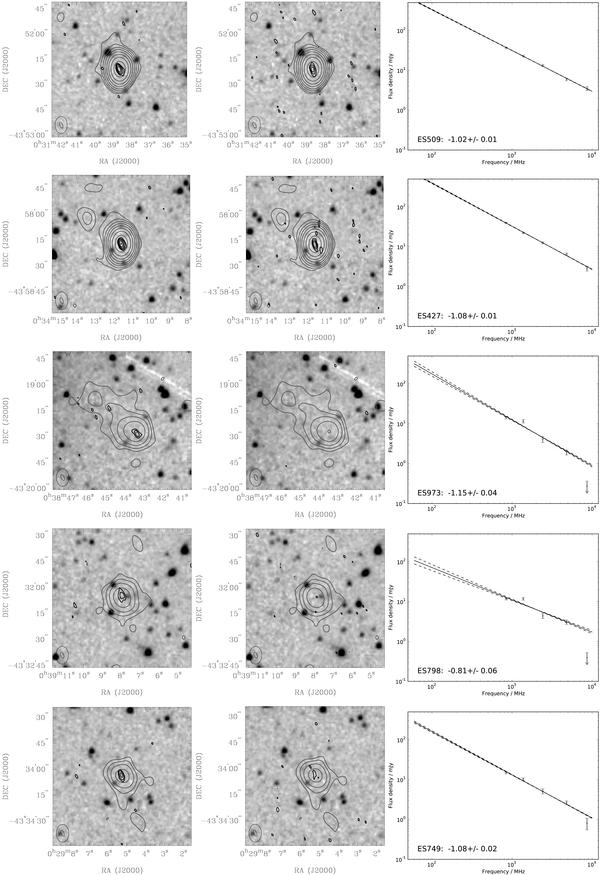
Each row shows a grey-scale image of the Spitzer 3.6 μm observations, superimposed with grey contours indicating the 1.4 GHz observations and black contours showing the 4.8 GHz (left panel) and 8.6 GHz (middle panel) observations. The IFRS are always the sources at the image centres. Contours start at 3σ and increase by factors of 2. The 1.4 GHz restoring beam and the 4.8 GHz/8.6 GHz restoring beams, which are the same size, are indicated with ellipses in the lower left corners of the images. The right panel shows the flux density measurements available for a source and 3σ upper limits where no detection was made (indicated with arrows). The solid line indicates the best available spectral index, and dashed lines indicate a power-law with an index 1σ larger and 1σ smaller than determined by the data. We note that all sources have a signal-to-noise ratio of more than 9 in the 1.4 GHz observations, so there is no doubt that they are real sources and not spurious.

Current usage metrics show cumulative count of Article Views (full-text article views including HTML views, PDF and ePub downloads, according to the available data) and Abstracts Views on Vision4Press platform.
Data correspond to usage on the plateform after 2015. The current usage metrics is available 48-96 hours after online publication and is updated daily on week days.
Initial download of the metrics may take a while.