Fig. 3
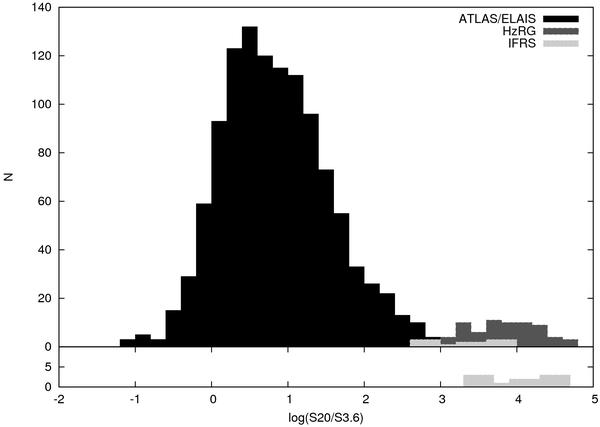
Top panel: the distribution of S20/S3.6 in the general source population, in the sample of HzRG by Seymour et al. (2007), and in our IFRS sample. The IFRS clearly occupy a different regime than the general population, and tend to overlap more with the HzRG. Bottom panel: the histogram of the IFRS S20/S3.6 ratios as in the upper panel, shifted to the right by log(5) = 0.7. This takes into account that Norris et al. (2010) found no IR counterparts for IFRS in a stacking analysis with a 5 times higher sensitivity. On average the IFRS then have a S20/S3.6 which is about two times higher than that of the HzRG.
Current usage metrics show cumulative count of Article Views (full-text article views including HTML views, PDF and ePub downloads, according to the available data) and Abstracts Views on Vision4Press platform.
Data correspond to usage on the plateform after 2015. The current usage metrics is available 48-96 hours after online publication and is updated daily on week days.
Initial download of the metrics may take a while.