Fig. 4
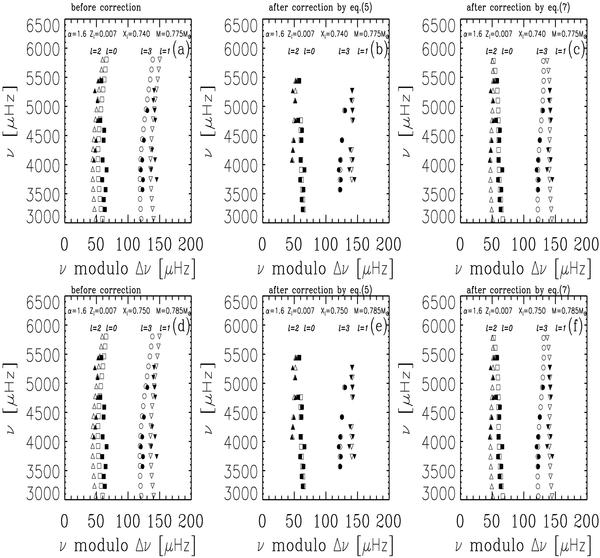
Echelle diagrams for the optimal models M1 (upper panel) and M2 (lower panel). Left panel shows the case before applying near-surface corrections. Middle panel shows the case after applying near-surface corrections, according to Eq. (5). Right panel shows the case after applying near-surface corrections, according to Eq. (7). Open symbols refer to the theoretical frequencies, and filled symbols refer to the observable frequencies. Squares are used for l = 0 modes, diamonds for l = 1 modes, triangles for l = 2 modes, and circles for l = 3. The observable frequencies correspond to the average large separation about 170 μHz (see text for details).
Current usage metrics show cumulative count of Article Views (full-text article views including HTML views, PDF and ePub downloads, according to the available data) and Abstracts Views on Vision4Press platform.
Data correspond to usage on the plateform after 2015. The current usage metrics is available 48-96 hours after online publication and is updated daily on week days.
Initial download of the metrics may take a while.