Free Access
Fig. 3
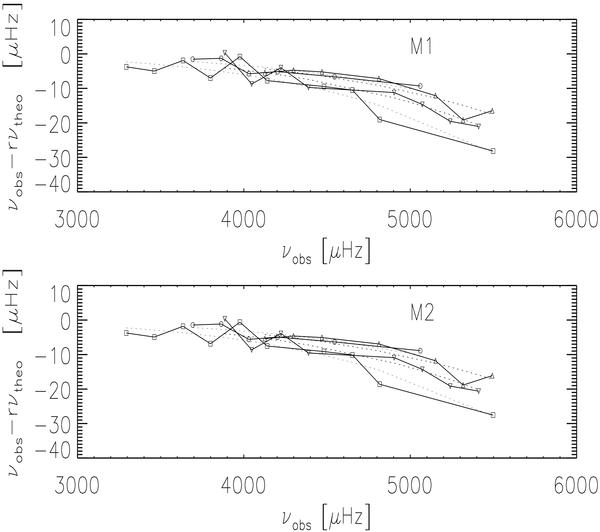
The difference between observed and best-fit model frequencies, according to the left term of Eq. (4). Squares are used for l = 0 modes, diamonds for l = 1 modes, triangles for l = 2 modes, and circles for l = 3. Dotted lines show the power-law function, according to the right term of Eq. (4).
Current usage metrics show cumulative count of Article Views (full-text article views including HTML views, PDF and ePub downloads, according to the available data) and Abstracts Views on Vision4Press platform.
Data correspond to usage on the plateform after 2015. The current usage metrics is available 48-96 hours after online publication and is updated daily on week days.
Initial download of the metrics may take a while.