Fig. 1
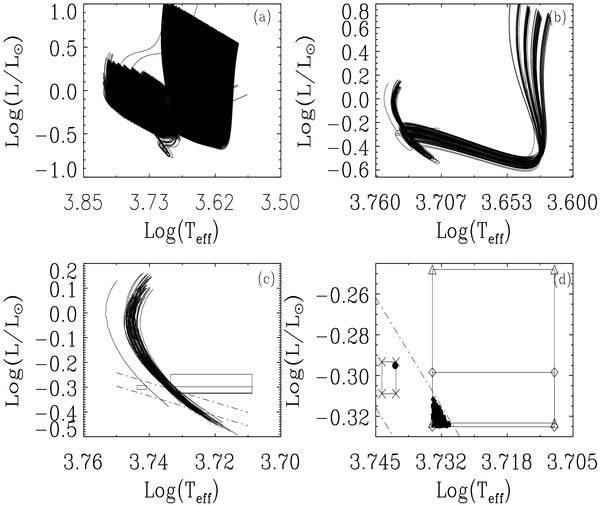
a) All evolutionary tracks in the HR diagram; b) Evolutionary tracks falling in the error boxes from pre-main sequence to main sequence; c) Blow up the evolutionary tracks falling in the error boxes in the main sequence; d) The selected models falling in the error boxes. Error box A (5525 ± 12 K, 0.50 ± 0.006 L⊙) is denoted by crosses, error box B (5264 ± 100 K, 0.52 ± 0.03 L⊙) denoted by triangles, and error box C (5264 ± 100 K, 0.488 ± 0.010 L⊙) denoted by diamonds, respectively.
Current usage metrics show cumulative count of Article Views (full-text article views including HTML views, PDF and ePub downloads, according to the available data) and Abstracts Views on Vision4Press platform.
Data correspond to usage on the plateform after 2015. The current usage metrics is available 48-96 hours after online publication and is updated daily on week days.
Initial download of the metrics may take a while.