Fig. 2
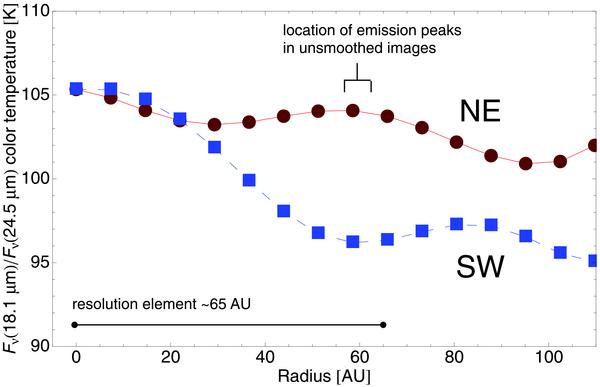
Color temperature profile of the HR 4796A disk based on photometric measurements at 18.1 μm and 24.5 μm (images “cross-convolved” to achieve the same spatial resolution). The NE profile is represented by circles, and the SW profile is represented by squares. Combined measurement uncertainties from both bandpasses are smaller than the size of the data points. The temperatures at the location of the peak dust density in the ring (labeled) are the key values to note.
Current usage metrics show cumulative count of Article Views (full-text article views including HTML views, PDF and ePub downloads, according to the available data) and Abstracts Views on Vision4Press platform.
Data correspond to usage on the plateform after 2015. The current usage metrics is available 48-96 hours after online publication and is updated daily on week days.
Initial download of the metrics may take a while.