Free Access
Fig. 8
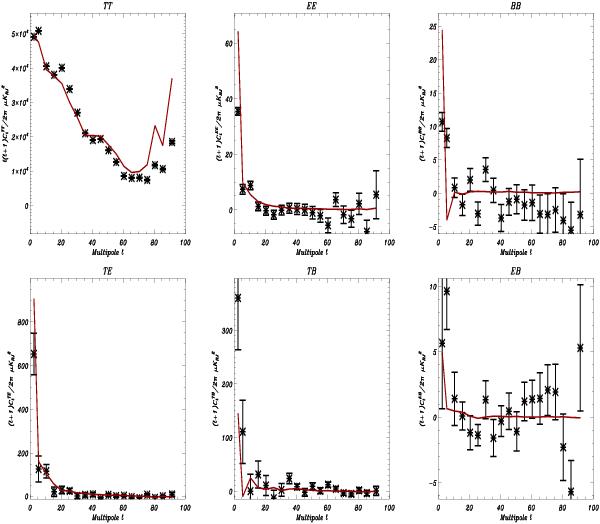
From left to right and from top to bottom: power spectra  ,
, ,
, ,
, ,
, ,
, at 353 GHz computed from Archeops data (black) and the model of thermal dust emission with MLS magnetic field for the best fit model parameters (red) for the full sky.
Current usage metrics show cumulative count of Article Views (full-text article views including HTML views, PDF and ePub downloads, according to the available data) and Abstracts Views on Vision4Press platform.
Data correspond to usage on the plateform after 2015. The current usage metrics is available 48-96 hours after online publication and is updated daily on week days.
Initial download of the metrics may take a while.