Fig. 2
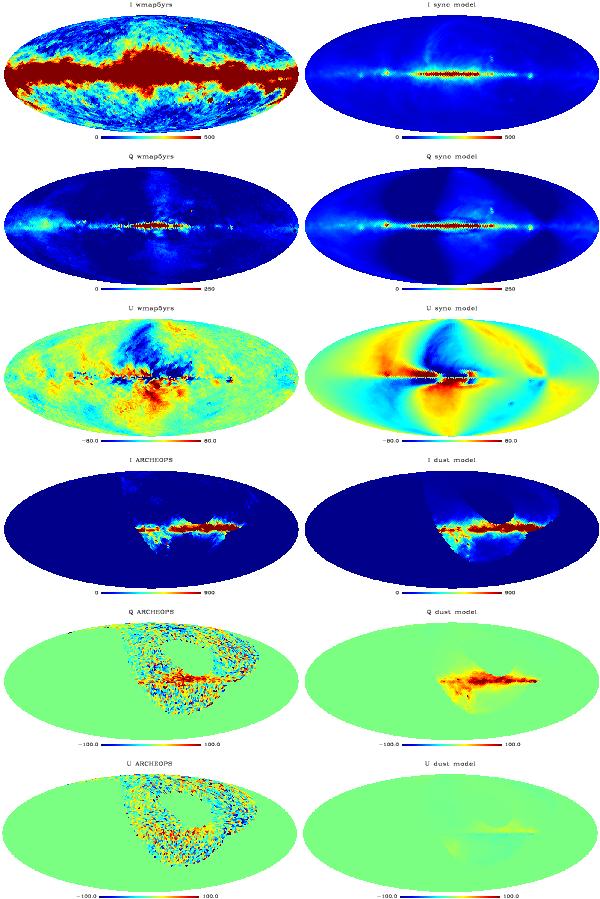
Form top to bottom: maps in intensity, I, and polarization Q and U at 23 GHz for the WMAP 5-year data (left) and the model of synchrotron emission with MLS magnetic field for the best fit model parameters (right) and at 353 GHz for the Archeops data (left) and the model of thermal dust emission with MLS magnetic field for the best fit model parameters (right). The 353 GHz maps are rotated by 180° for better visualization. All the maps are in KRJ units.


Current usage metrics show cumulative count of Article Views (full-text article views including HTML views, PDF and ePub downloads, according to the available data) and Abstracts Views on Vision4Press platform.
Data correspond to usage on the plateform after 2015. The current usage metrics is available 48-96 hours after online publication and is updated daily on week days.
Initial download of the metrics may take a while.