Fig. 6
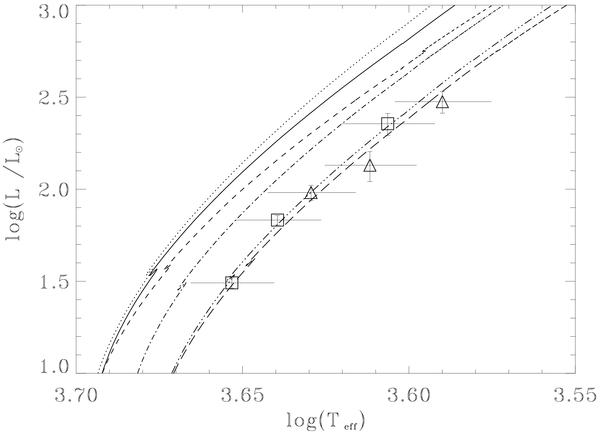
RGBs in the HR diagram for models cgm1 to cgm5 of Table 4. The track of model mlt1 of Table 3 is also given for comparison. The solid line is model cgm1, the dashed line is model mlt1, the dot-dashed line is model cgm2, the three-dot-dashed line is model cgm3 and the long dashed line is model cgm4. The dotted line is model cgm5. The data are the six giants of group I defined in the text and Fig. 2. Following Fig. 4 the squares and triangles respectively stand for solar and subsolar metallicity objects. Only models cgm3 and cgm4 with lower αcgm than the other models fit the data satisfactorily.
Current usage metrics show cumulative count of Article Views (full-text article views including HTML views, PDF and ePub downloads, according to the available data) and Abstracts Views on Vision4Press platform.
Data correspond to usage on the plateform after 2015. The current usage metrics is available 48-96 hours after online publication and is updated daily on week days.
Initial download of the metrics may take a while.