Fig. 5
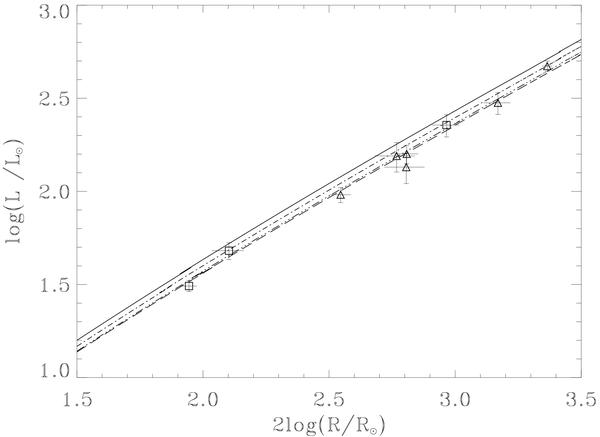
RGBs in a bolometric luminosity vs. stellar squared radius diagram for models mlt1, mlt4, mlt5, and mlt6 of Table 3. The lines conventions are similar to those in Fig. 4. Models mlt2 and mlt3 are not shown as they could hardly be distinguished from the track of model mlt1. The data are the nine giants of group II defined in text. As in Fig. 4, square symbols are for objects within 0.04 dex of solar metallicity, triangles represent objects within 0.06 dex of [Fe/H] = −0.17. The best fits are obtained for the models mlt5 and mlt6.
Current usage metrics show cumulative count of Article Views (full-text article views including HTML views, PDF and ePub downloads, according to the available data) and Abstracts Views on Vision4Press platform.
Data correspond to usage on the plateform after 2015. The current usage metrics is available 48-96 hours after online publication and is updated daily on week days.
Initial download of the metrics may take a while.