Fig. 4
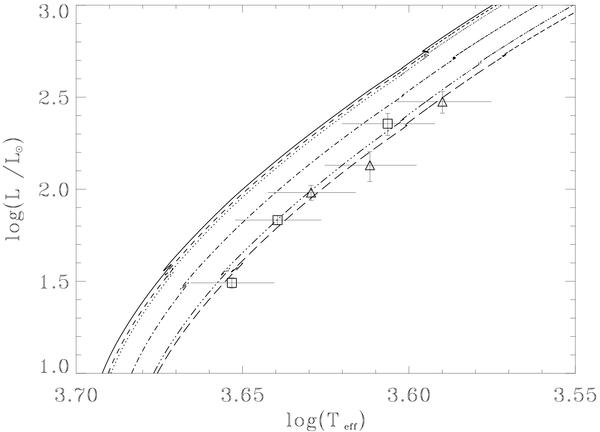
RGBs in the HR diagram for models mlt1 to mlt6 of Table 3. The solid line is model mlt1, the dotted line is model mlt2, the dashed line is model mlt3, the dot-dashed line is model mlt4, the three-dot dashed line is model mlt5, and the long-dashed line is model mlt6. Models mlt2 and mlt3 show mass and helium fraction changes with respect to model mlt1. They are hardly discernable from this model. Model mlt4 shows the metallicity effect with respect to model mlt1. Only models mlt5 and mlt6 with lower αmlt than the previous models fit the data satisfactorily. The data are the six giants of “group I” defined in the text and Fig. 2. Square symbols are for objects within 0.04 dex of solar metallicity, while triangles are for objects within 0.06 dex of [Fe/H] = −0.17. The error bars in log (Teff) are taken from McWilliam (1990), the error bars in log luminosity are adapted from Table 1.
Current usage metrics show cumulative count of Article Views (full-text article views including HTML views, PDF and ePub downloads, according to the available data) and Abstracts Views on Vision4Press platform.
Data correspond to usage on the plateform after 2015. The current usage metrics is available 48-96 hours after online publication and is updated daily on week days.
Initial download of the metrics may take a while.