Fig. 4
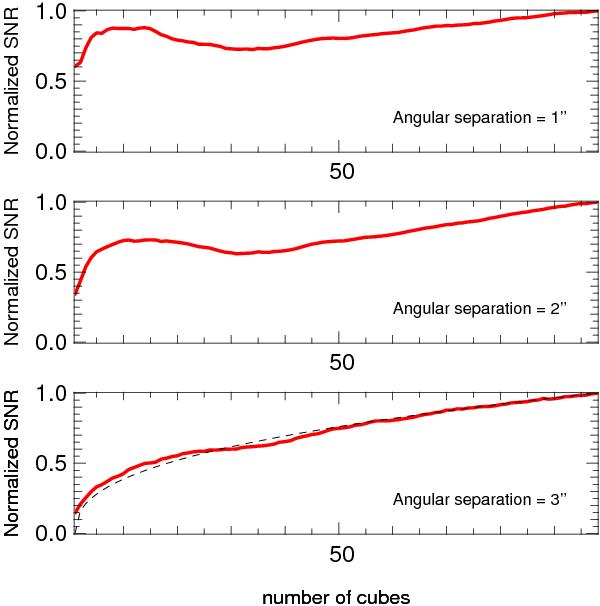
Normalized SNR as a function of the number of co-added cubes used for the final post-processed image. The curves were obtained by computing the spatial rms in a 20 × 20 pixels box at 3′′, 2′′ and 1′′ from the primary. Recall that in the present data one cube is composed of 1000 images with 30 ms exposure from which the 30% “best” (brightest speckle) images are selected. We overplotted the power-law that best reproduce the experimental data for 3′′ separation, namely a N-0.4 law (dotted line). The x-axis starts at value 0, and each sub-interval represents 5 cubes.
Current usage metrics show cumulative count of Article Views (full-text article views including HTML views, PDF and ePub downloads, according to the available data) and Abstracts Views on Vision4Press platform.
Data correspond to usage on the plateform after 2015. The current usage metrics is available 48-96 hours after online publication and is updated daily on week days.
Initial download of the metrics may take a while.