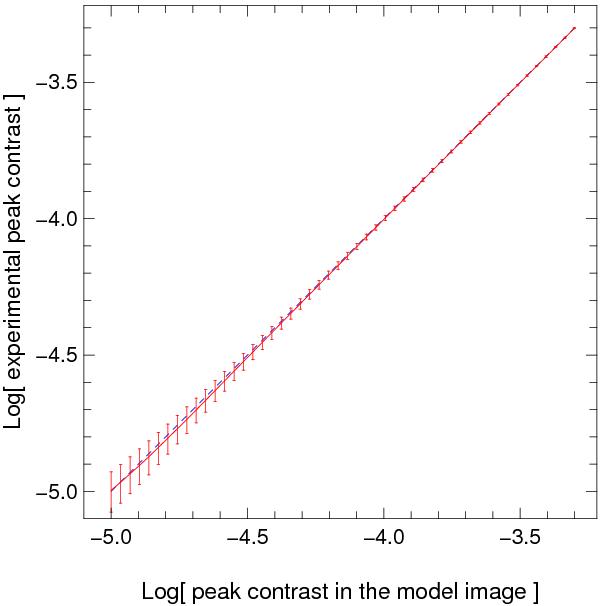
Fig. 3

Evaluation of the impact of the image post-processing on the peak value of a nearby companion. The solid curve with error bars shows, in the y-axis, the experimental mean and rms values of the measured peak contrast after image post-processed for various simulated companions contrast at a distance comparable to HD 130948 BC as an input. The x-axis shows the input pre-determined model contrast. The dash line is the y = x curve and represents for comparison the contrast values ideally unaffected by the post-processing stage.
Current usage metrics show cumulative count of Article Views (full-text article views including HTML views, PDF and ePub downloads, according to the available data) and Abstracts Views on Vision4Press platform.
Data correspond to usage on the plateform after 2015. The current usage metrics is available 48-96 hours after online publication and is updated daily on week days.
Initial download of the metrics may take a while.


