Free Access
Fig. 2
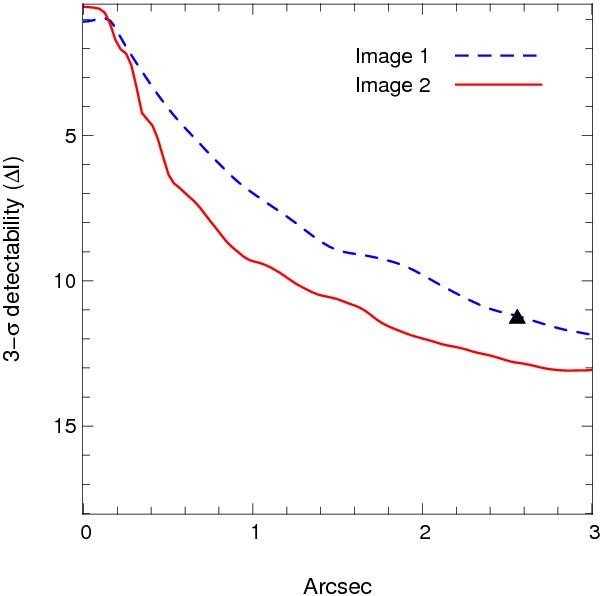
3-σ detectability curve estimated in the two cases of Image 1 (dashed line) and Image 2 (continuous line). These data were obtained with 100 cubes and a 30% best-frames selection per cube. The filled triangle shows the position of HD 130948 C (see text for details).
Current usage metrics show cumulative count of Article Views (full-text article views including HTML views, PDF and ePub downloads, according to the available data) and Abstracts Views on Vision4Press platform.
Data correspond to usage on the plateform after 2015. The current usage metrics is available 48-96 hours after online publication and is updated daily on week days.
Initial download of the metrics may take a while.