Fig. 3
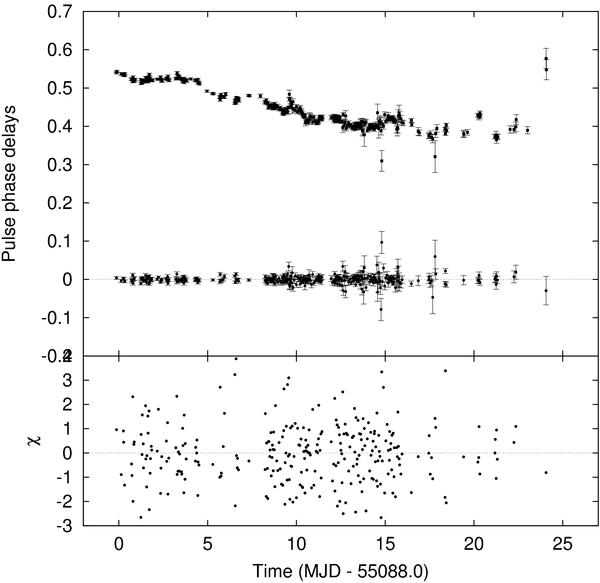
In the top panel of this figure the pulse phase delays (filled squares) and the corresponding pulse phase delay differences (filled circles) of the data corrected with the orbital ephemeris obtained from the fit to the frequency Doppler shifts are reported. Each pulse phase point is obtained by fitting the folded pulse profile over about 1500 s of data. It is evident that there is no trace of this fluctuation in the pulse phase delay differences, giving a striking confirmation of the goodness of the method. In the bottom panel, we report the residuals (in σ units) with respect to the best fit orbital solution derived from the pulse phase delay differences using the timing technique described in the text.
Current usage metrics show cumulative count of Article Views (full-text article views including HTML views, PDF and ePub downloads, according to the available data) and Abstracts Views on Vision4Press platform.
Data correspond to usage on the plateform after 2015. The current usage metrics is available 48-96 hours after online publication and is updated daily on week days.
Initial download of the metrics may take a while.