Fig. 1
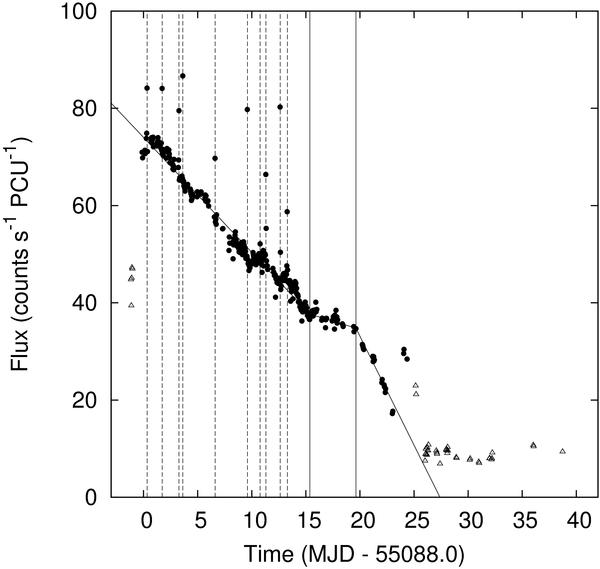
PCU 2 count rate (2–25 keV), subtracted of its background, is reported as a function of time during the outburst. The superimposed model represents the best fit using a piecewise linear function. The abrupt flux increase at the end of the outburst is due to the onset of an outburst from the AMP XTE J1751-305. The dashed vertical lines correspond to the type-I bursts present in the observation, while the continuous vertical lines correspond to the slope change, which depends on the model used to describe the count rate. The filled circles are relative to the ObsId 94041, while the triangles are the XTE J1751-305 observation (ObsId 94042).
Current usage metrics show cumulative count of Article Views (full-text article views including HTML views, PDF and ePub downloads, according to the available data) and Abstracts Views on Vision4Press platform.
Data correspond to usage on the plateform after 2015. The current usage metrics is available 48-96 hours after online publication and is updated daily on week days.
Initial download of the metrics may take a while.