Fig. 1
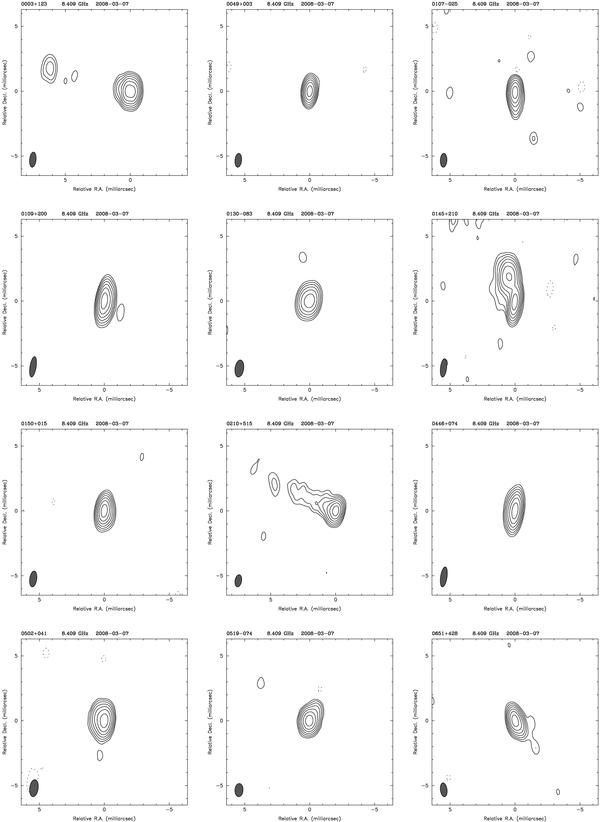
Examples of VLBI maps (at X-band) for the first 12 sources from GC030 listed in Table 3 (0003+123, 0049+003, 0107−025, 0109+200, 0130−083, 0145+210, 0150+015, 0210+515, 0446+074, 0502+041, 0519−074 and 0651+428). Image parameters are listed in Table 3. The first contour level is typically 1% of the peak brightness, with successive contours increasing by a factor of 2. The FWHM Gaussian restoring beam applied to the images is shown as an ellipse in the lower left of each panel.
Current usage metrics show cumulative count of Article Views (full-text article views including HTML views, PDF and ePub downloads, according to the available data) and Abstracts Views on Vision4Press platform.
Data correspond to usage on the plateform after 2015. The current usage metrics is available 48-96 hours after online publication and is updated daily on week days.
Initial download of the metrics may take a while.