Fig. 9
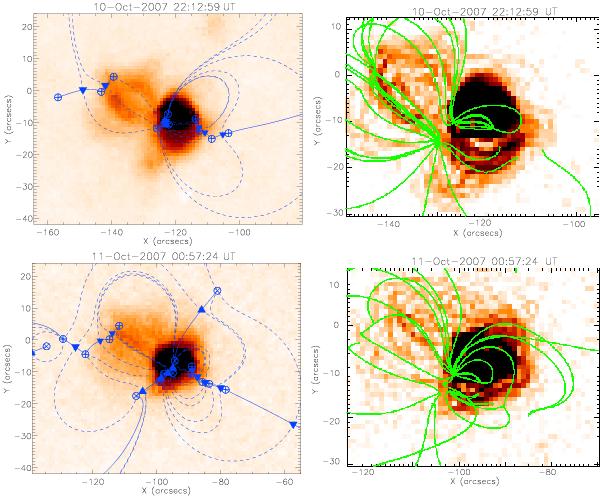
Figure showing two examples of our comparison between the X-ray emission seen in XRT and the similarities to the potential field model we applied. The two figures on the left show negative XRT images overlaid with the photospheric footprints of the calculated topological structure of the extrapolated magnetic field. Positive magnetic sources are labelled as ⊕ , negative magnetic sources as ⊗ , positive null points as ▾, negative null points as ▴, spines as solid curves, and the intersections of separatrix surfaces with the photosphere as dashed curves. It is possible to form a good impression of the whole 3D magnetic field structure, given that each null point’s associated 3D separatrix surface must close via spine field-lines in the photosphere in cases where its own two separatrix traces do not terminate at the same source. No field-line can cross a separatrix surface or a spine. The two figures on the left show the same XRT images after being put through an edge-detection process. These images have then been overlaid with field-lines (in green) generated by the potential field model to identify any structural similarities.
Current usage metrics show cumulative count of Article Views (full-text article views including HTML views, PDF and ePub downloads, according to the available data) and Abstracts Views on Vision4Press platform.
Data correspond to usage on the plateform after 2015. The current usage metrics is available 48-96 hours after online publication and is updated daily on week days.
Initial download of the metrics may take a while.