Fig. 8
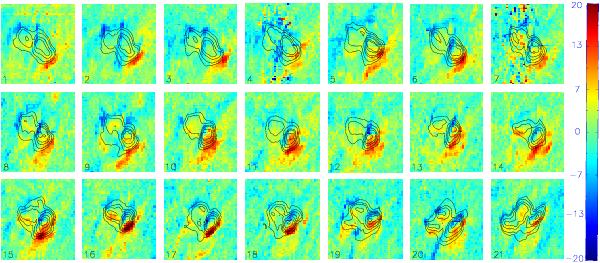
Sequence of Dopplergrams of area around XBP from 18:45 on the 10-October-2007 every 30 min until 06:32 on the 11-October-2007. The numbers in the bottom-left of each image correspond to their entries in Table 3 (NB file 22 is not shown in this plot). Velocities were found using EIS Fe xii 195.119 Å. The velocities shown are between ± 20 km s-1 and are over-plotted with intensity contours. The field-of-view of each box is 70″ × 70″.
Current usage metrics show cumulative count of Article Views (full-text article views including HTML views, PDF and ePub downloads, according to the available data) and Abstracts Views on Vision4Press platform.
Data correspond to usage on the plateform after 2015. The current usage metrics is available 48-96 hours after online publication and is updated daily on week days.
Initial download of the metrics may take a while.