Fig. 7
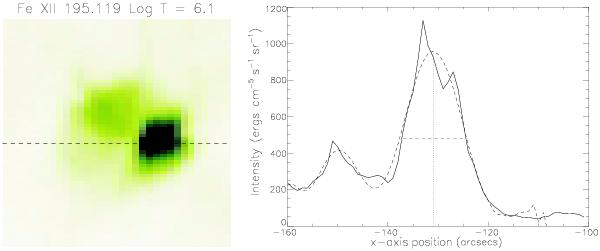
Example showing how the width of the XBP was calculated. The left figure shows an EIS Fe xii 195.119 Å image with a cross-section taken through the middle of the bright point. The right figure is the intensity plotted along this cross-section. A fit of the curve was made and the FWHM of this curve was determined to be the width.
Current usage metrics show cumulative count of Article Views (full-text article views including HTML views, PDF and ePub downloads, according to the available data) and Abstracts Views on Vision4Press platform.
Data correspond to usage on the plateform after 2015. The current usage metrics is available 48-96 hours after online publication and is updated daily on week days.
Initial download of the metrics may take a while.