Fig. 1
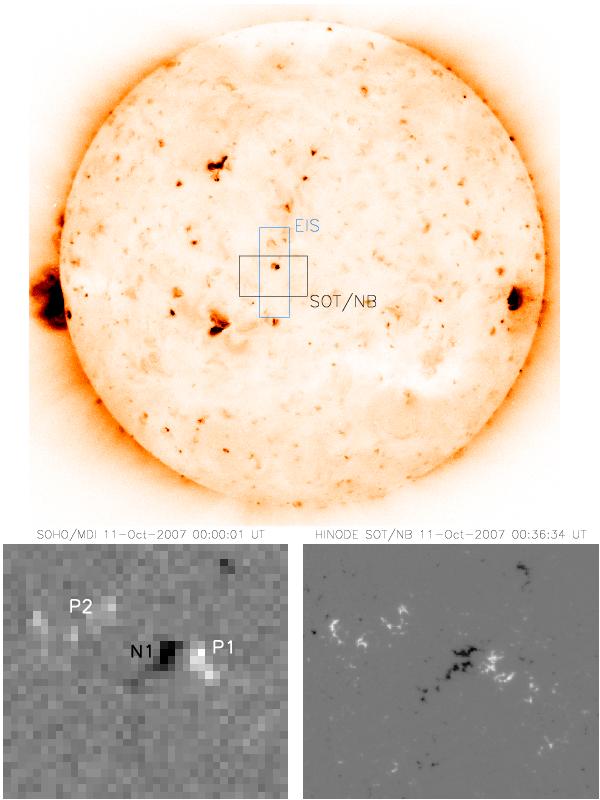
The top panel shows a negative image of full disk XRT Al_poly/Open filter showing the location of the XBP at 00:07:11 UT on 11 October 2007. The over-plotted boxes show the EIS and SOT full fields of view. The lower left panel shows SOHO/MDI data with the three magnetic source regions labelled as they are referred to in the text. The lower right panel shows same-time SOT/NB data. The field-of-view of both lower images is 100″ × 85″.
Current usage metrics show cumulative count of Article Views (full-text article views including HTML views, PDF and ePub downloads, according to the available data) and Abstracts Views on Vision4Press platform.
Data correspond to usage on the plateform after 2015. The current usage metrics is available 48-96 hours after online publication and is updated daily on week days.
Initial download of the metrics may take a while.