Free Access
Fig. 1
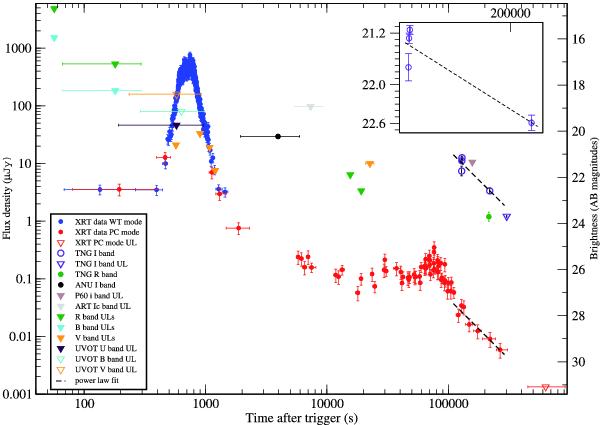
Optical and X-ray (1 keV) light curves. Horizontal error bars represent the exposure times. Dashed lines represent the time power law fits to the 4 TNG I-band detections and to the last 7 X-ray data points. The inserted box zooms in on the TNG I-band detections.
Current usage metrics show cumulative count of Article Views (full-text article views including HTML views, PDF and ePub downloads, according to the available data) and Abstracts Views on Vision4Press platform.
Data correspond to usage on the plateform after 2015. The current usage metrics is available 48-96 hours after online publication and is updated daily on week days.
Initial download of the metrics may take a while.