Fig. 5
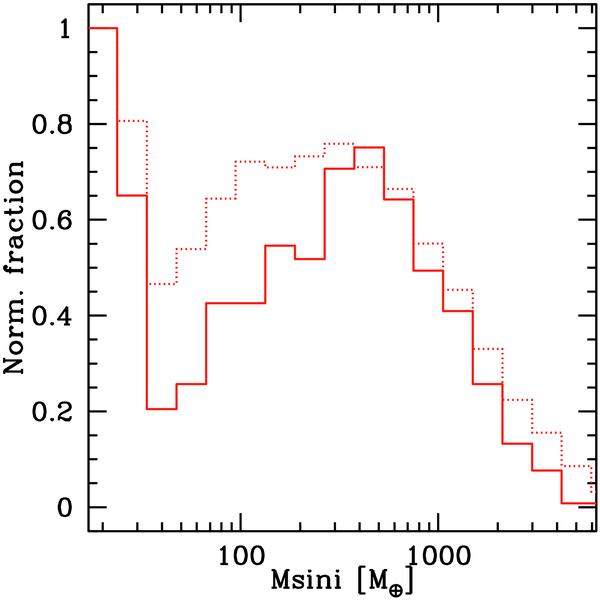
Theoretical mass distribution from Neptunian to Jovian mass planets obtained from population synthesis calculations. The solid line shows a population where the planetary gas accretion rate was only limited by the disk accretion rate if the planet has a mass higher than the local gas isolation mass. For the dotted line, the limit was always used. Both distributions were normalized to unity at the first bin at about 20 Earth masses.
Current usage metrics show cumulative count of Article Views (full-text article views including HTML views, PDF and ePub downloads, according to the available data) and Abstracts Views on Vision4Press platform.
Data correspond to usage on the plateform after 2015. The current usage metrics is available 48-96 hours after online publication and is updated daily on week days.
Initial download of the metrics may take a while.