Fig. 1
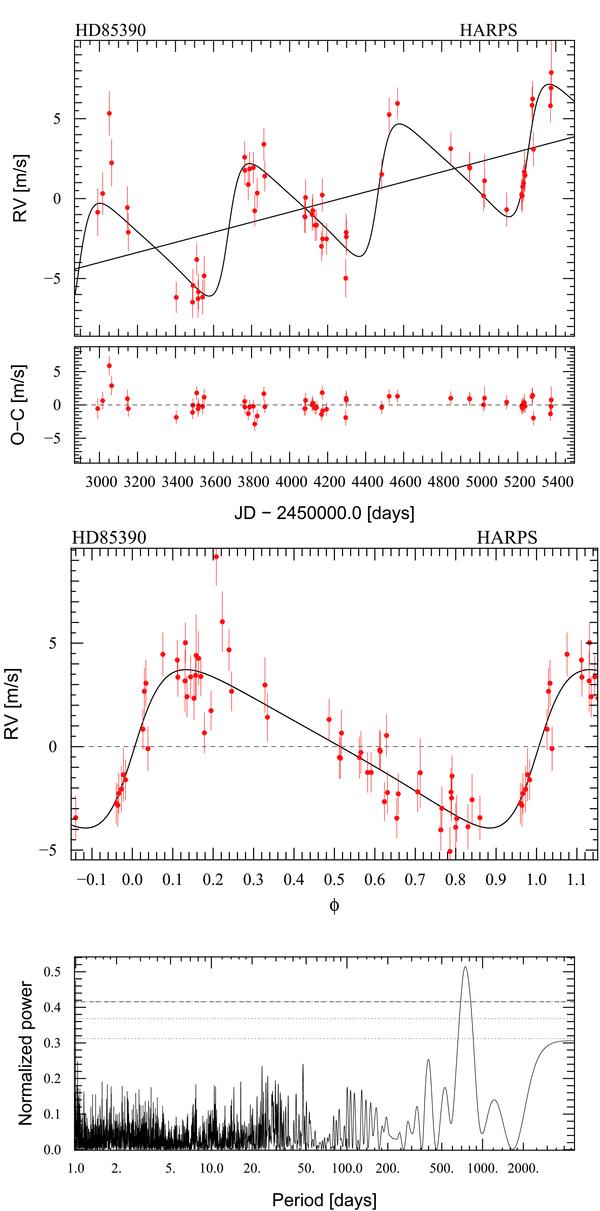
Radial velocity measurements of HD 85390 as a function of Julian Date (top). The six earliest measurements have larger error bars. The best solution with a linear drift plus one Keplerian orbit is also displayed as the residuals to this model. The middle panel shows the radial velocity as a function of the orbital phase for HD 85390 b, with the effect of the drift removed. The bottom panel shows the generalized Lomb Scargle periodogram of the observations. The peak at a period of about 800 days is very prominent, and has a false alarm probability (FAP) of much less than 0.1%. The three horizontal lines indicate FAPs of 0.1, 1, and 10% from top to bottom.
Current usage metrics show cumulative count of Article Views (full-text article views including HTML views, PDF and ePub downloads, according to the available data) and Abstracts Views on Vision4Press platform.
Data correspond to usage on the plateform after 2015. The current usage metrics is available 48-96 hours after online publication and is updated daily on week days.
Initial download of the metrics may take a while.