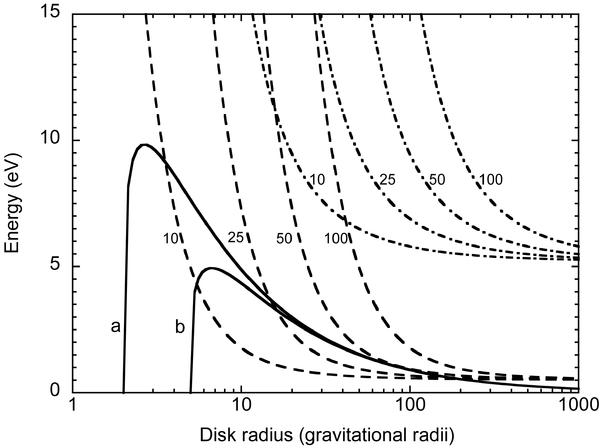
Fig. 4

Comparison of threshold energy and mean emitted energy for two accretion disk models. The mean energies of photons emitted by the disk at each radius are indicated by the solid curves. The curve labelled “a” represents the mean photon energy from a Shakura-Sunyaev accretion disk with parameters Mb = 109 M⊙, ṁ = 10-2, rjet/rg = 2; the curve labeled “b” represents the mean energy from a modified disk with the same parameters except that rjet/rg = 5. The dot-dash curves to the upper right show the threshold energy for disk photons emitted from a given radius interacting with 100 GeV gamma-rays. The dashed curves represent the threshold energy for disk photons interacting with 1 TeV gamma rays. The different threshold curves are derived from gamma-ray emission heights of 10, 25, 50 and 100 gravitational radii respectively, as indicated on the curves.
Current usage metrics show cumulative count of Article Views (full-text article views including HTML views, PDF and ePub downloads, according to the available data) and Abstracts Views on Vision4Press platform.
Data correspond to usage on the plateform after 2015. The current usage metrics is available 48-96 hours after online publication and is updated daily on week days.
Initial download of the metrics may take a while.


