Fig. 9
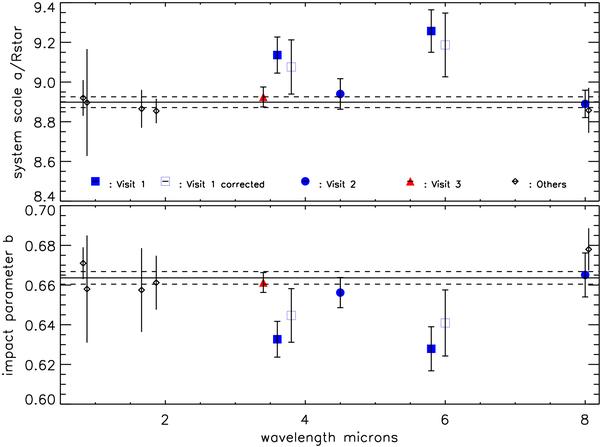
Orbital parameters derived from several studies. Top panel: impact parameter b; bottom panel: system scale a/R⋆. Diamonds are values from several other studies: data are from Pont et al. (2007) in the visible, from Sing et al. (2009) in the near infrared and from Knutson et al. (2007a,b) at 8.0 μm also measured by Carter & Winn (2010). Blue squares are from our visit 1 and 2 observations in the four IRAC channels (Désert et al. 2009). The red square are from the observations of visit 3 (this work). Continuous and dashed straight black lines indicate the average and error values obtained from data excluding outliers. These values are considered as best estimates for b and a/R⋆. Parameters derived from visit 1 at 3.6 and 5.8 μm respectively are significantly different from the best estimates. The empty squares correspond to the derived parameters using to the observation of visit 1 and the transit light curve models which take into account the occulted spots during ingress or egress.
Current usage metrics show cumulative count of Article Views (full-text article views including HTML views, PDF and ePub downloads, according to the available data) and Abstracts Views on Vision4Press platform.
Data correspond to usage on the plateform after 2015. The current usage metrics is available 48-96 hours after online publication and is updated daily on week days.
Initial download of the metrics may take a while.