Fig. 8
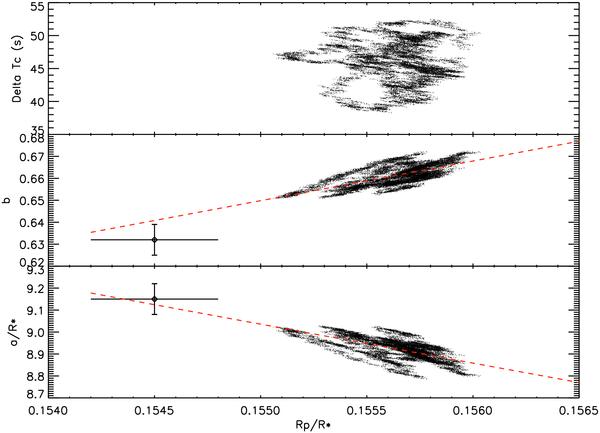
Joint distributions of parameters obtained from the prayer bead method using the subarray mode observations. The x-axis corresponds to radius ratios for all the panels. The top panel is the fit of the central time, the middle and bottom panel, correspond to the impact parameter and the scale of the system respectively. The diamonds with error bars correspond to the results obtained from the observations of visit 1 (Désert et al. 2009). The dashed red lines correspond to linear fits of the points from visit 3, and reveal the correlations between Rp/R⋆, b and a/R⋆.
Current usage metrics show cumulative count of Article Views (full-text article views including HTML views, PDF and ePub downloads, according to the available data) and Abstracts Views on Vision4Press platform.
Data correspond to usage on the plateform after 2015. The current usage metrics is available 48-96 hours after online publication and is updated daily on week days.
Initial download of the metrics may take a while.