Fig. 7
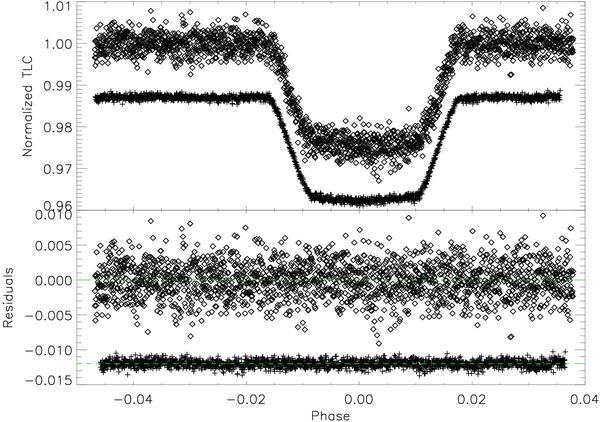
Top panel: normalized transit light curves obtained in stellar mode (diamonds) and in subarray mode (crosses). The subarray mode transit light curve is shifted vertically for display purpose. The subarray mode transit light curve is binned by 64 to obtain the same number of data points (~1900 points) as the stellar mode transit light curve. Bottom panel: residuals obtained from the fits of the transit light curve. Residuals from the binned subarray mode transit light curve are shifted vertically (for display) and are four times smaller.
Current usage metrics show cumulative count of Article Views (full-text article views including HTML views, PDF and ePub downloads, according to the available data) and Abstracts Views on Vision4Press platform.
Data correspond to usage on the plateform after 2015. The current usage metrics is available 48-96 hours after online publication and is updated daily on week days.
Initial download of the metrics may take a while.