Fig. 5
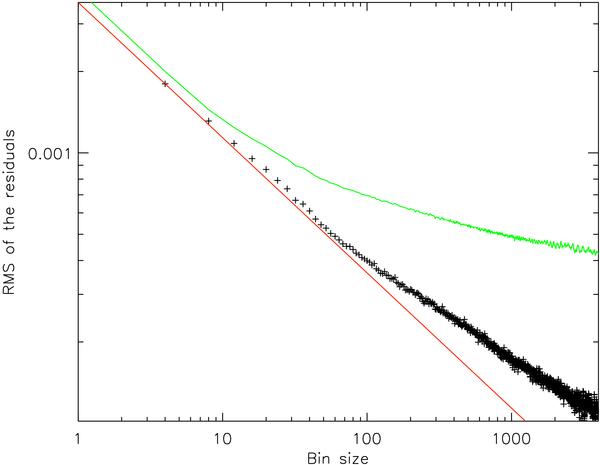
Root-mean-square of binned residuals versus bin size. The solid continuous red line is proportional to N −1/2 and is normalized to match the value for bin size N = 4. The top continuous green curve corresponds to bin residuals without pixel-phase decorrelation. Black crosses correspond to bin residuals with pixel-phase effect decorrelation. Remaining red-noise becomes apparent for bins larger than 50 data points (6.25 s).
Current usage metrics show cumulative count of Article Views (full-text article views including HTML views, PDF and ePub downloads, according to the available data) and Abstracts Views on Vision4Press platform.
Data correspond to usage on the plateform after 2015. The current usage metrics is available 48-96 hours after online publication and is updated daily on week days.
Initial download of the metrics may take a while.