Free Access
Fig. 2
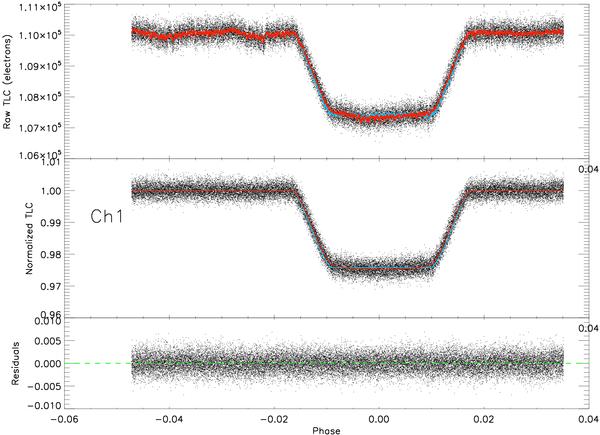
Top panel: raw transit light curve obtained in subarray mode binned by four with its fit overplotted in red. Pixel-phase effect is clearly visible. Middle panel: normalized transit light curve. Bottom panel: residuals obtained from the fits of the transit light curve.
Current usage metrics show cumulative count of Article Views (full-text article views including HTML views, PDF and ePub downloads, according to the available data) and Abstracts Views on Vision4Press platform.
Data correspond to usage on the plateform after 2015. The current usage metrics is available 48-96 hours after online publication and is updated daily on week days.
Initial download of the metrics may take a while.