Fig. 12
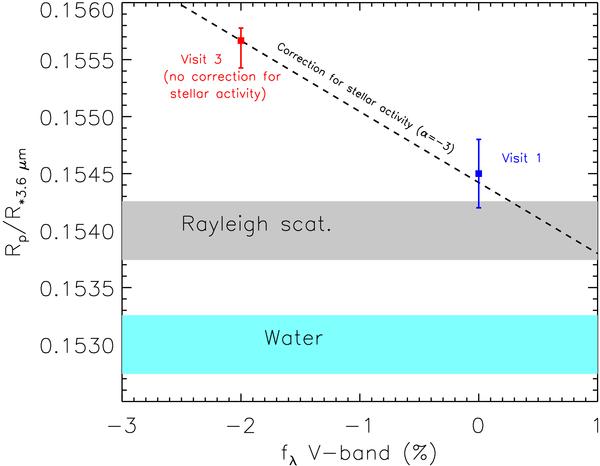
Measured values of Rp/R⋆ ratios at 3.6 μm as fonction of the relative decrease of stellar flux due to spots (in V-band). The blue and red squares are the Rp/R⋆ derived from the observations of visit 1 and 3 respectively. The dotted line corresponds to the theoretical correction of the relative difference between the measured radius ratio and the expected value as function of the relative decrease of stellar flux in the V-band fλ. Using ground based photometric follow-up (Fig. 10), we set f(3.6 μm) to zero for visit 1 (see text 4.5.1). The Rp/R⋆ we derive from the observations of visit 3 (no correction) is above the one obtained in visit 1 (4σ). To compare both visits, the Rp/R⋆ derived from visit 3 has to be corrected for spots (Sect. 4.5.3). Simultaneous observation in V-band shows that fV − band = −2% during visit 3 (Fig. 10). (Rp/R⋆)Corrected for visit 3 agree with Rp/R⋆ derived in visit 1 for a slope α = −3.
Current usage metrics show cumulative count of Article Views (full-text article views including HTML views, PDF and ePub downloads, according to the available data) and Abstracts Views on Vision4Press platform.
Data correspond to usage on the plateform after 2015. The current usage metrics is available 48-96 hours after online publication and is updated daily on week days.
Initial download of the metrics may take a while.